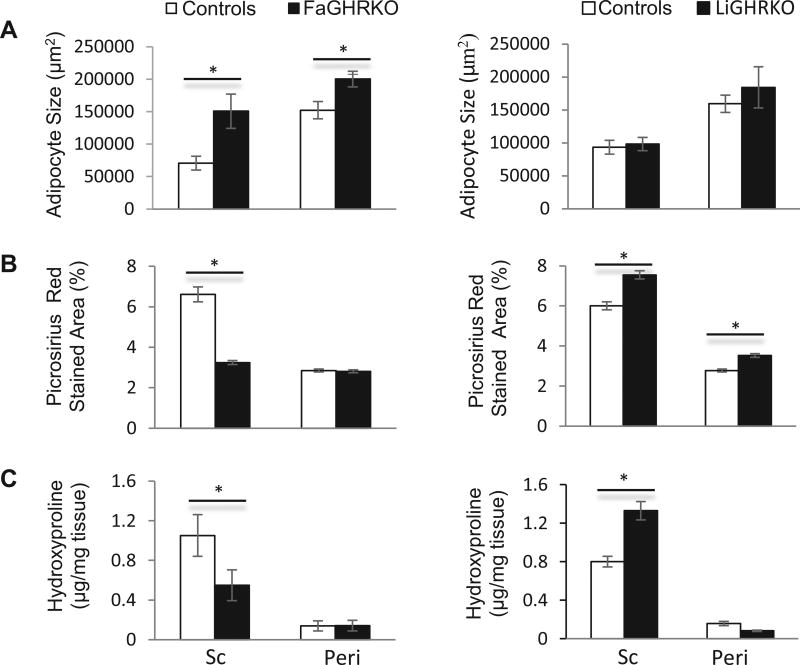
Fig. 5.
Comparison of A, average adipocyte size; B, picrosirius red stained area; and C, hydroxyproline content in FaGHRKO mice (left panels) and LiGHRKO mice (right panels) compared to floxed littermate controls at 6 months of age (n=8 for all groups). In panel A and using a two-way ANOVA, FaGHRKO mice had a significant main effect of genotype (F1, 28=14.4, p=0.001) and depot (F1,28 =15.1, p=0.001) on adipocyte size. In panel B, a two-way ANOVA found significant main effects for genotype (FaGHRKO: F1,476=76.4, p=4.1×10⁻¹⁷; LiGHRKO: F1,446 =55.0, p=6.1×10⁻¹³), depot (LiGHRKO: F1,476=115.3, p=3.1×10⁻²⁴; LiGHRKO: F1, 446=550.4, p 7.1×10−80) and the interaction of genotype and depot (FaGHRKO: F1,476=72.5, p=2.2×10⁻¹⁶; LiGHRKO: F1, 446=6.6, p=0.01) for picrosirius red stained area for both FaGHRKO and LiGHRKO samples compared to floxed controls. In panel C, a two-way ANOVA found significant main effects for genotype (FaGHRKO: F1,28=3.5, p=0.05; LiGHRKO: F1,24=6.2, p=0.02) and depot (FaGHRKO: F1,28=16.5, p=3.6×10⁻⁴; LiGHRKO: F1, 446 =93.1, p 9.3×10⁻¹⁰) but only a significant the interaction of genotype and depot in LiGHRKO samples (F1,24=12.9, p=0.001) compared to floxed controls. All data are expressed as mean ± SEM of eight mice per group. *, P < 0.05 using one way ANOVA with contrasts tests.

