Figure 2.

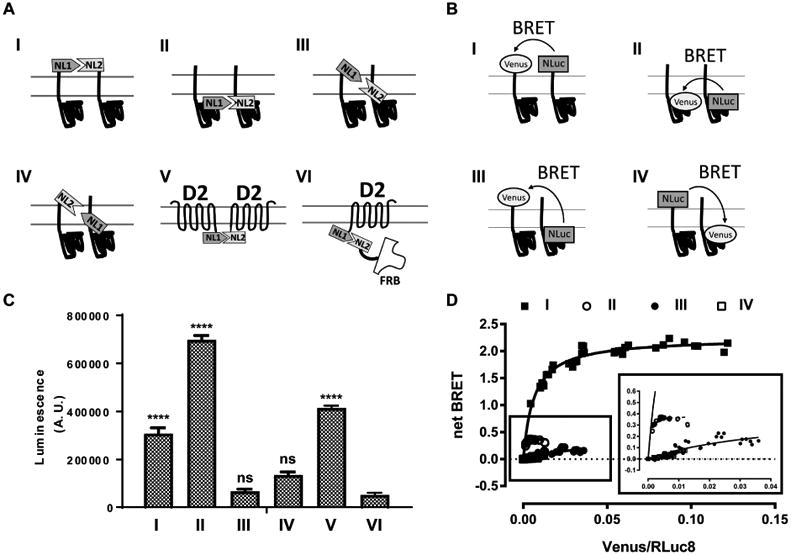
N- and C-termini of σ1R are not close to each other in the proximity assays. (A) Schematic representation for NanoLuciferase complementation assay. (B) Schematic representation for BRET assay. (C) NanoLuciferase complementation is performed between σ1R and σ1R with four different configurations (I-IV; NL1-σ1:NL2-σ1, σ1-NL1:σ1-NL2, NL1-σ1:σ1-NL2, σ1-NL1:NL2-σ1), between D2R-NL1 and D2R-NL2 (V), or between D2R-NL1 and FRB-NL2 (VI). One way ANOVA followed by posthoc Dunnett's test against D2R-NL1:FRB-NL2 (VI) shows significance (p < 0.0001) for NL1-σ1:NL2-σ1 (I), σ1-NL1:σ1-NL2 (II), and D2R-NL1:D2R-NL2 (V). Data represents mean ± S.E.M. (n = 3 or more). (D) Acceptor-saturating BRET between σ1R and σ1R using N- and C-terminal fusion constructs to address the relative transmembrane topology: NL-σ1 and VN-σ1 (I, solid square), σ1-NL and σ1-VN (II, open circle), σ1-NL and VN-σ1 (III, solid circle), and NL-σ1 and σ1-VN (IV, open square). Inset magnifies the curves for σ1-NL and σ1-VN (II), σ1-NL and VN-σ1 (III), and NL-σ1 and σ1-VN (IV). The results of both assays are consistent with the crystal structure showing N- and C-termini on opposite sides of membrane.
