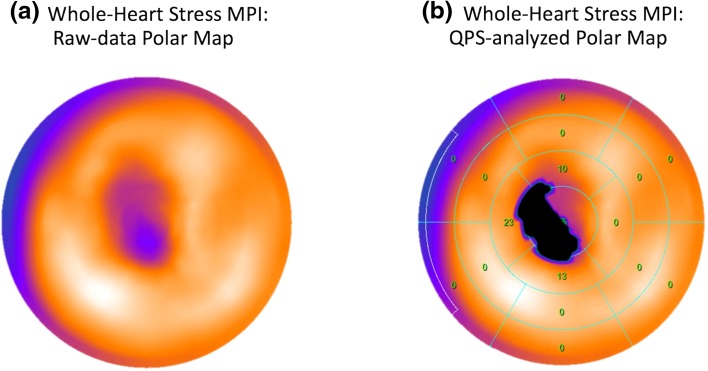
Fig. 4.
Example stress SPECT MPI data for a case wherein ischemia is detected on the basis of the whole-heart TPD score but 3-slice TPD measurement fails to detect the severe ischemia. a Polar map with raw perfusion data; b automatically analyzed whole-heart polar maps generated in the QPS software (whole-heart stress TPD = 6.0%). The presented case is the stress MPI data for a 58-year-old female patient showing a severe apical perfusion defect, which is consistent with her invasive angiography results that indicated 90% LAD stenosis. In b, the measured perfusion defect region is shown in black and the numbers in each segment indicate the corresponding defect extent (in percentage) for that segment. The 3-slice stress TPD (computed from the conventional short-axis slice positions as shown in Fig. 2) was 0.9%, which is below the 3% abnormality threshold. LAD left anterior descending, MPI myocardial perfusion imaging, TPD total perfusion deficit

