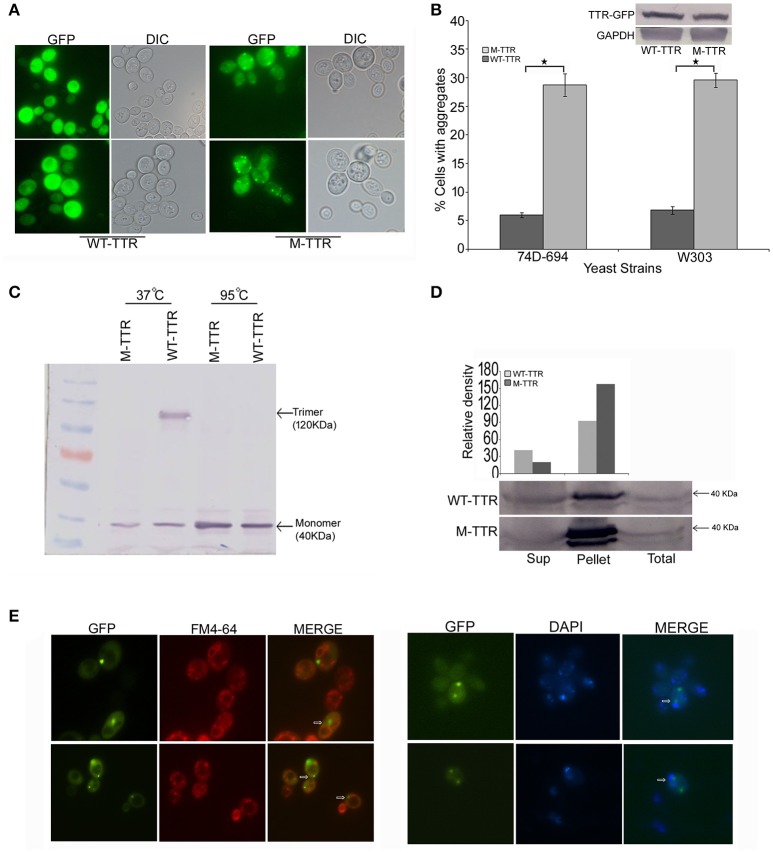
Figure 1.
Aggregation and native state of WT-TTR and M-TTR in yeast. (A) The microscopic images of TTR aggregation state in yeast cells overexpressing WT-TTR-GFP and M-TTR-GFP after incubation for 72 h at 30°C. (B) The aggregate formation due to overexpression of WT-TTR-GFP and M-TTR-GFP was quantified in 74D-694 and W303 strains by calculating percentage of cells with aggregates. Three independent transformants and more than 600 cells were analyzed for each construct. Error bars represent standard errors of the mean of the three transformants. The significant difference in aggregation between WT-TTR-GFP and M-TTR-GFP was analyzed by using two-tailed t-test (*depicts p-value < 0.05). The inset on top shows the equal protein levels of WT-TTR-GFP and M-TTR-GFP as determined by immunoblotting with anti-GFP antibody. (C) Western blot showing the native state of WT-TTR-GFP and M-TTR-GFP in yeast. Cells expressing the two GFP fusion constructs were harvested after 24 h, lysed and the lysates were incubated under non-denaturing (37°C and without β-ME) and denaturing (95°C with β-ME) conditions. Samples were resolved on 10% SDS-PAGE and immunoblotted using anti-GFP antibody. (D) Centrifugation assay showing the distribution of WT-TTR-GFP and M-TTR-GFP in supernatant (Sup) and pellet fraction. Cells expressing the WT-TTR-GFP and M-TTR-GFP were harvested after 72 h and protein was isolated. Total protein was normalized before subjecting to centrifugation and equal volumes of all the fractions were loaded. The fractions were resolved on 10% SDS and probed using anti-GFP antibody. One tenth of total protein has been used as a loading control. (E) Cellular localization of M-TTR-GFP aggregates was analyzed by staining cells overexpressing M-TTR-GFP aggregates with FM4-64 (vacuolar) and DAPI (nuclear) dye. The images of same cells were captured under FITC and DAPI filters. The images were merged to analyze the localization of M-TTR-GFP aggregates. The white arrows in the merged panel shows the aggregates localized near the vacuole (FM4-64) and nucleus (DAPI).

