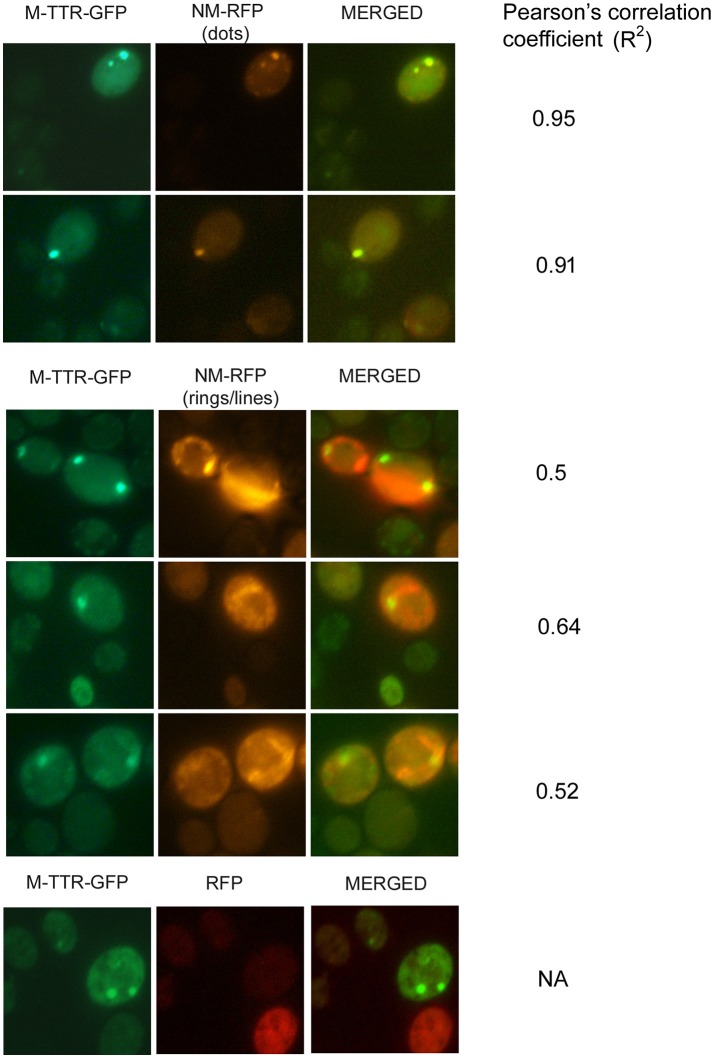
Figure 4.
Colocalization of M-TTR-GFP and Sup35 aggregates. The microscopic images showing colocalization of M-TTR-GFP dots and Sup35 dots-, lines-, ring/mesh- like aggregates on co-overexpression of M-TTR-GFP and NM domain of Sup35 fused to RFP (NM-RFP) in yeast cells. Images were captured under FITC (GFP) and TRITC (RFP) channels and merged using NIS-Elements AR3.2 software. Pearson's correlation coefficient was determined using Coloc2.

