Fig. 1.
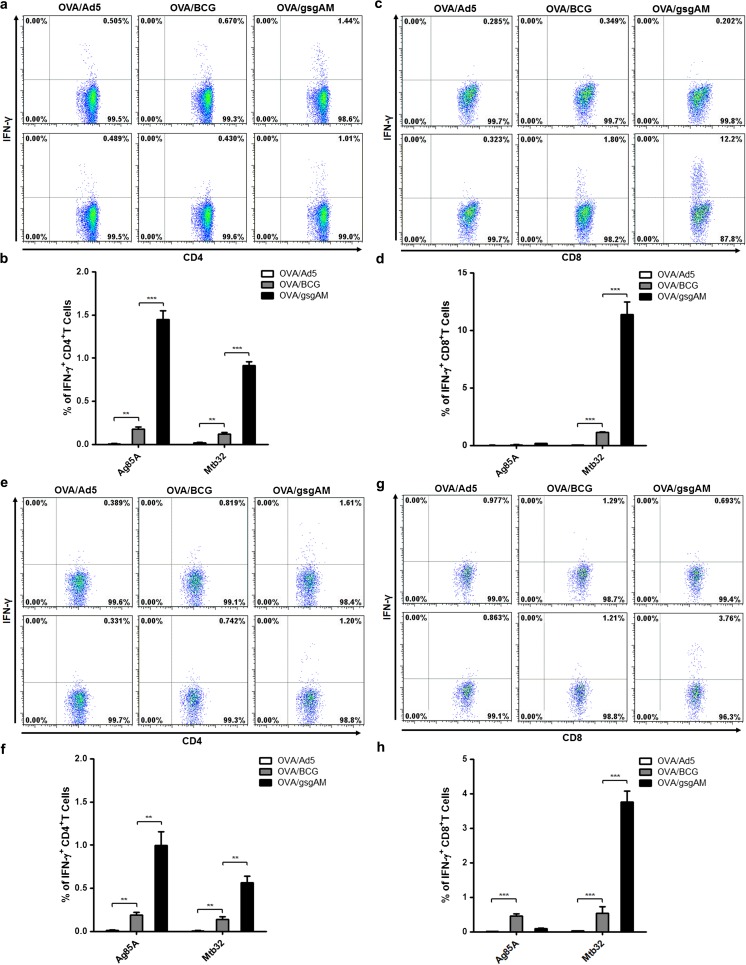
Ad5-gsgAM immunization generates robust antigen-specific T cell responses in OVA-sensitized mice. OVA-sensitized mice were immunized as depicted in Fig. S1. One week after the final immunization, lymphocytes were isolated from the spleens and lungs of different groups of mice and were stimulated with peptide pools of Ag85A or Mtb32. Unstimulated lymphocytes from each group were used as controls. Then, the cells were stained with CD3-PerCP, CD4-FITC, CD8-APC, and IFN-γ-PE and subjected to FACS analysis. a Representative dot plots of Ag85A-specific (upper panel) and Mtb32-specific (bottom panel) CD4+T cells secreting IFN-γ in the spleens. b The percentages of antigen-specific IFN-γ+CD4+T cells in total CD4+T cells in the spleens. c Representative dot plots of Ag85A-specific (upper panel) and Mtb32-specific (bottom panel) CD8+T cells secreting IFN-γ in the spleens. d The percentages of antigen-specific IFN-γ+CD8+T cells in total CD8+T cells in the spleens. e Representative dot plots of Ag85A-specific (upper panel) and Mtb32-specific (bottom panel) CD4+T cells secreting IFN-γ in the lungs. f The percentages of antigen-specific IFN-γ+CD4+T cells in total CD4+T cells in the lungs. g Representative dot plots of Ag85A-specific (upper panel) and Mtb32-specific (bottom panel) CD8+T cells secreting IFN-γ in the lungs. h The percentages of antigen-specific IFN-γ+CD8+T cells in total CD8+T cells in the lungs. Data are presented as mean ± standard error of the mean (SEM, n = 5 mice per group). **P < 0.01, ***P < 0.001. Similar results were obtained from two additional experiments

