Fig. 4.
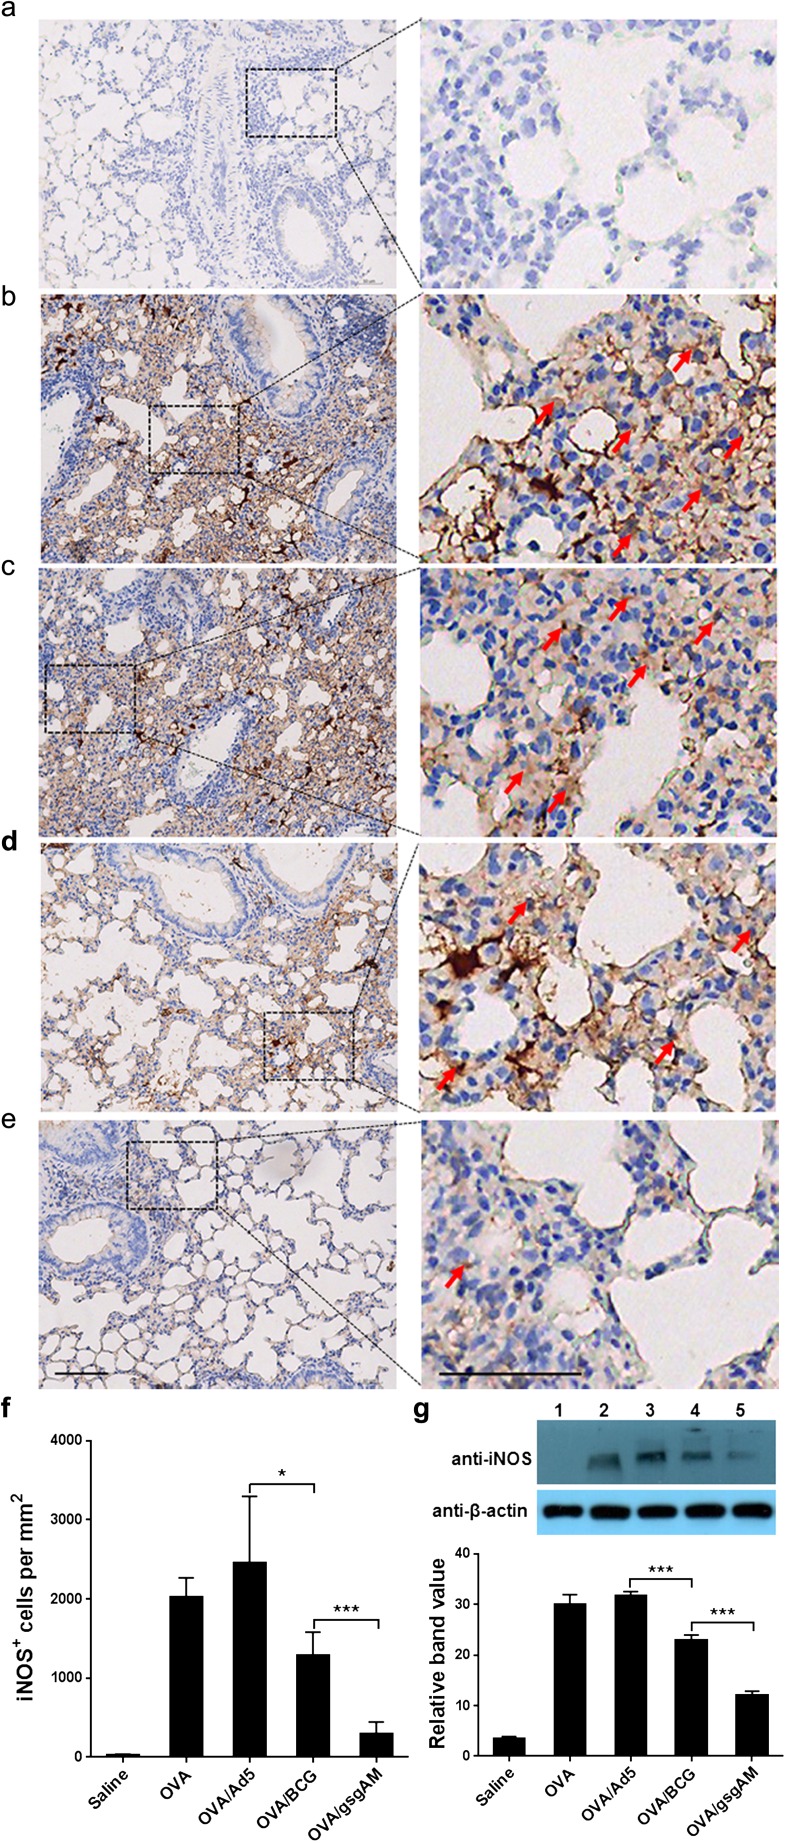
The expression of iNOS in the lungs of the experimental and control mice. Twenty-four hours after the final challenge, mouse lung tissue sections were immuno-stained with anti-iNOS antibodies. a–e Representative photomicrographs of immuno-stained lung sections from Saline (a), OVA (b), OVA/Ad5 (c), OVA/BCG (d), and OVA/gsgAM (e) mice were shown. The iNOS-expressing cells are marked by red arrows. Bar = 100 μm. f Quantitative analysis of the iNOS-expressing cells in the lung tissue sections from each group of mice. Three sections of each mouse were analyzed. The iNOS-expressing cells in five random fields of each section were counted and calculated as cell numbers per square millimeter. Data are presented as the mean ± SEM (n = 4 to 6 mice per group). Representative results from one of three independent experiments are shown. *P < 0.05, ***P < 0.001. g The concentration of iNOS in the lung tissue homogenates pooled from five mice per group were examined with Western blot analysis (upper panel) and then quantified using ImageJ software (bottom panel). One representative gel from three independent experiments was shown. Lane 1: Saline mice; Lane 2: OVA mice; Lane 3: OVA/Ad5 mice; Lane 4: OVA/BCG mice; Lane 5: OVA/gsgAM mice. The density value of each band was read out and the net band value was obtained by deducting the background from the band value. The relative band value was calculated as the ratio of the net band value of iNOS vs that of β-actin. Data are presented as the mean ± SEM (n = 5 mice per group). Representative results from one of three independent experiments are shown. *P < 0.05, ***P < 0.001

