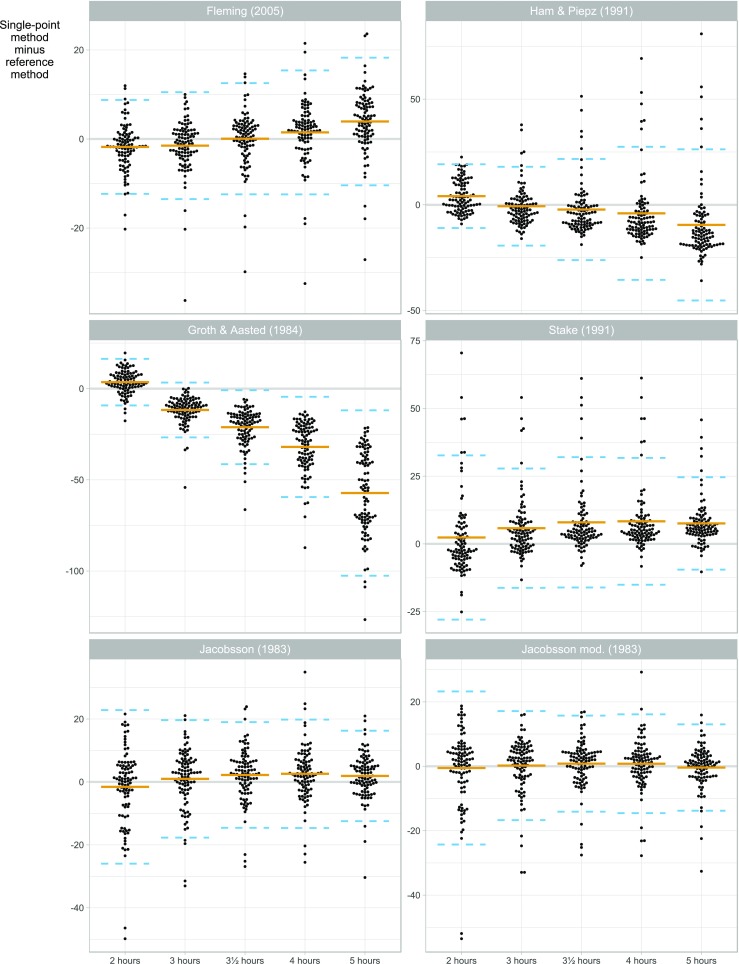
Fig. 2.

Plot of estimation error versus time point for glomerular filtration rate (GFR) calculated at five time points, stratified by estimation method (n = 96 children). The y-axis shows the difference between the single-point GFR [12, 13, 17, 20, 22, 26] and a reference GFR based on seven sampling time points. Each point corresponds to a combination of patient, estimation method and sample time. The solid horizontal line is the bias, i.e. the mean difference between the single-point GFR and the reference GFR. The dashed lines are limits of agreement, i.e. bias ± two standard deviations of the differences. For each estimation method, the figure can be used to compare the performance of the single-point GFR estimates at different sampling time-points
