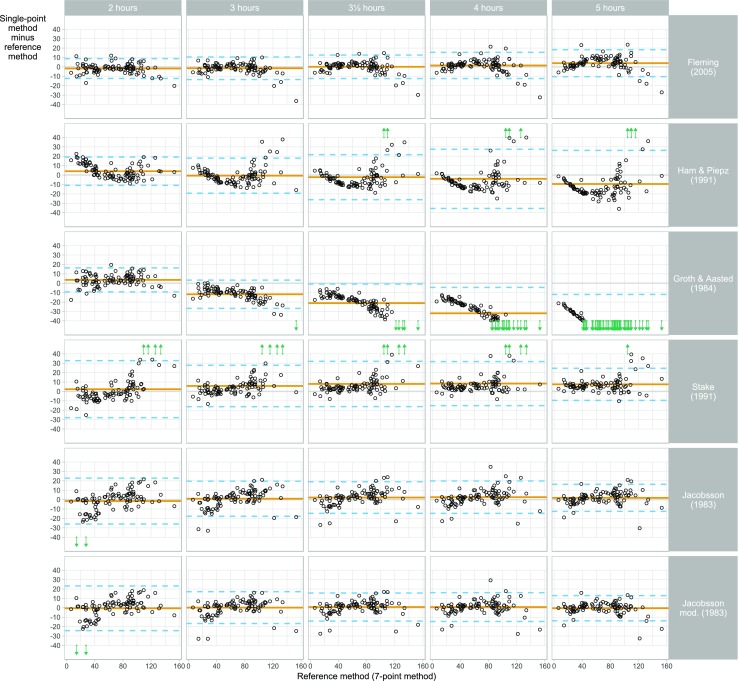
Fig. 3.

Plot of estimation error versus reference glomerular filtration rate (GFR) for GFR calculated by six single-sample formulas [12, 13, 17, 20, 22, 26] and at five sampling time points (n = 96 children). The y-axis shows the difference between the single-point GFR estimate and a reference GFR based on seven sampling time points. The x-axis shows the reference GFR. Each point corresponds to a combination of patient, determination method and sample time. The solid horizontal line is the bias, i.e. the mean difference between the single-point GFR and the reference GFR. The dashed lines are limits of agreement, i.e. bias ± two standard deviations of the differences. Large determination errors, i.e. errors outside the displayed range, are indicated by arrows. The figure can be used to examine patterns in how the estimation errors of the different estimation methods vary with GFR for each method and sampling time
