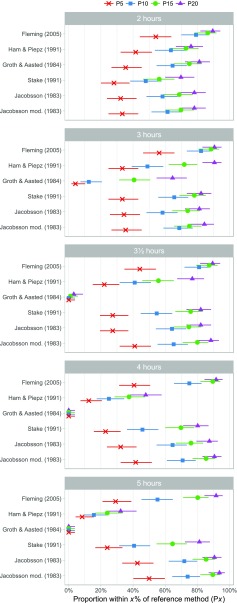
Fig. 4.
Percentage plot showing the determination accuracy of six single-sample determination methods [12, 13, 17, 20, 22, 26] at five sampling time points (n = 96 patients/children). Each symbol, labeled Px (P5, P10, P15 and P20), shows the calculated proportion of single-sample glomerular filtration rate (GFR) within x% of the reference method. The horizontal lines show the corresponding 95% confidence intervals

