
FIGURE 2.
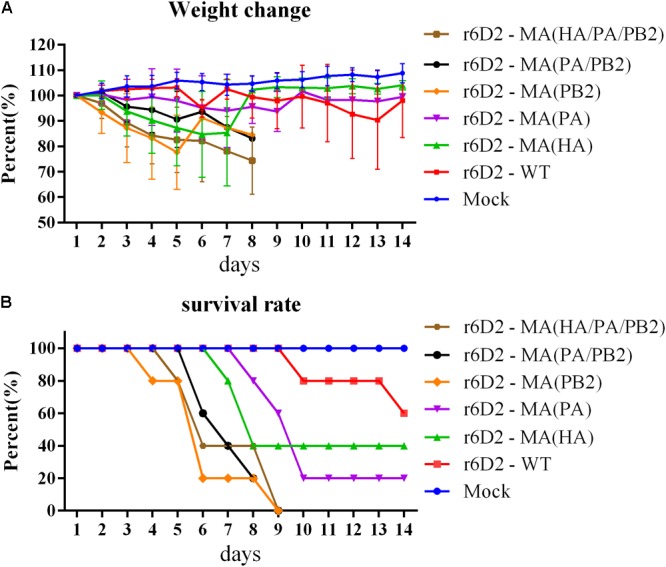
Weight change and survival rate of mice inoculated with 6D2 virus. (A) The weight change of mice inoculated with 106 TCID50 virus in 50 μl. (B) The survival rate of mice inoculated with 106 TCID50 virus in 50 μl.
Official websites use .gov
A
.gov website belongs to an official
government organization in the United States.
Secure .gov websites use HTTPS
A lock (
) or https:// means you've safely
connected to the .gov website. Share sensitive
information only on official, secure websites.
Weight change and survival rate of mice inoculated with 6D2 virus. (A) The weight change of mice inoculated with 106 TCID50 virus in 50 μl. (B) The survival rate of mice inoculated with 106 TCID50 virus in 50 μl.