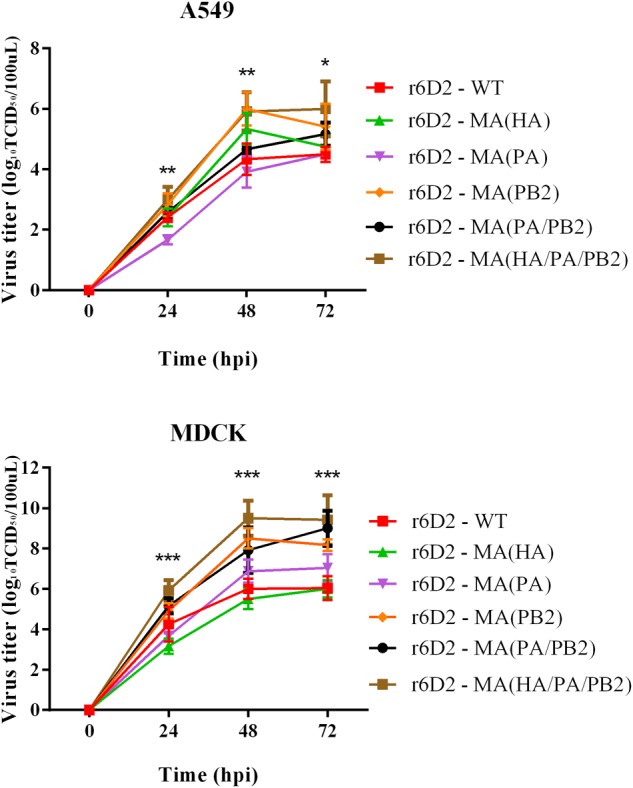
FIGURE 4.

Virus titer in supernatant of A549 and MDCK following infection. Triplicate cells (105 cells per well) were infected with different viruses at a multiplicity of infection (MOI) of 0.01. Supernatants were collected at 24, 48, and 72 h and subjected to virus tittering by TCID50. Three independent experiments were presented per point with mean value and standard deviation (SD), ∗P < 0.05, ∗∗P < 0.01, ∗∗∗P < 0.001, one-way ANOVA (Bonferroni correction adopted, see Supplementary Tables S1, S2).
