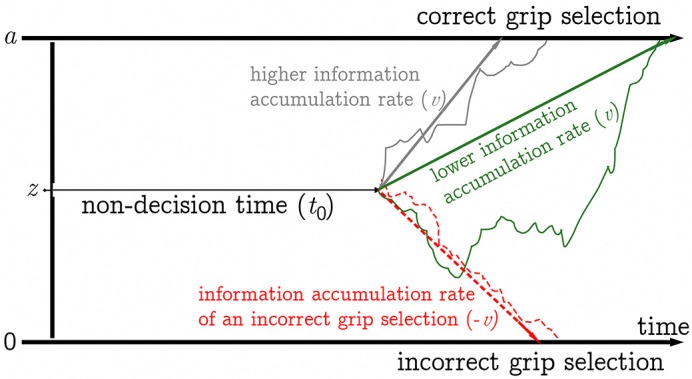
Figure 1.

Schematic illustration of the diffusion model. Non-decision time components are combined in the t0 parameter (represented by the thin black arrow). Three decision processes are shown (solid paths lead to correct grip selection, dashed path leads to incorrect grip selection). The decision processes start between the two decision boundaries (at 0 and a) at the level of the starting point z. A grip is selected when the corresponding decision boundary is reached. The gray path shows a decision process with a relatively higher mean rate of information accumulation (high drift rate (v), represented by the gray arrow), the green path shows a decision process with a lower mean rate of information accumulation (lower v, represented by the green arrow). The red path shows a decision process leading to an incorrect grip selection, the red arrow represents the corresponding rate of information accumulation.
