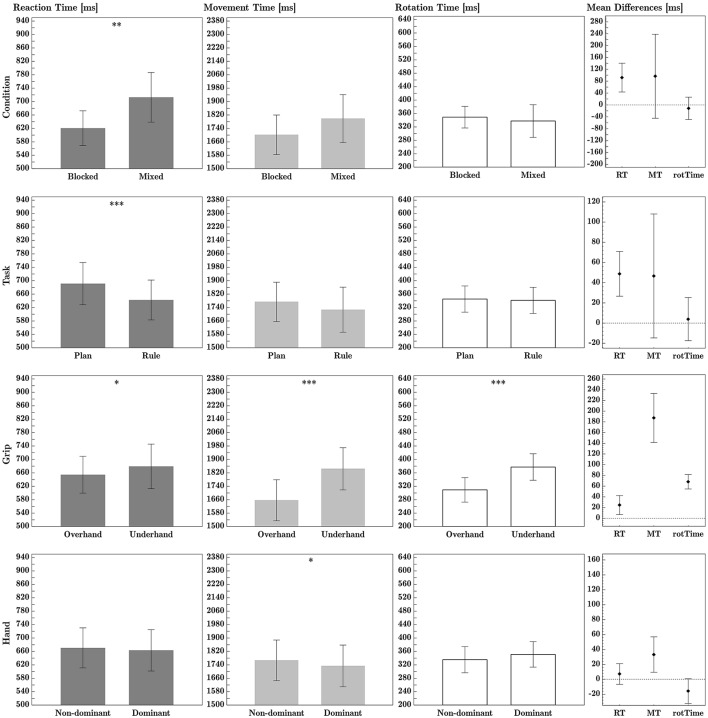
Figure 4.
Experiment B ANOVA main effects, for (from left to right column) reaction time, movement time and rotation time. Within-factor differences are shown in the far right column. All times are given in milliseconds. Error bars represent 95% confidence intervals. *, **, and *** denote significant differences with Holm-Bonferroni adjusted p-values padj < 0.05, < 0.01, and < 0.001, respectively. Calculation of mean difference times: Condition difference = (Mixed − Blocked); Task difference = (Plan − Rule); Grip difference = Underhand − Overhand); Hand difference = Non-dominant − Dominant. See Table 3 for effect sizes and p-values.

