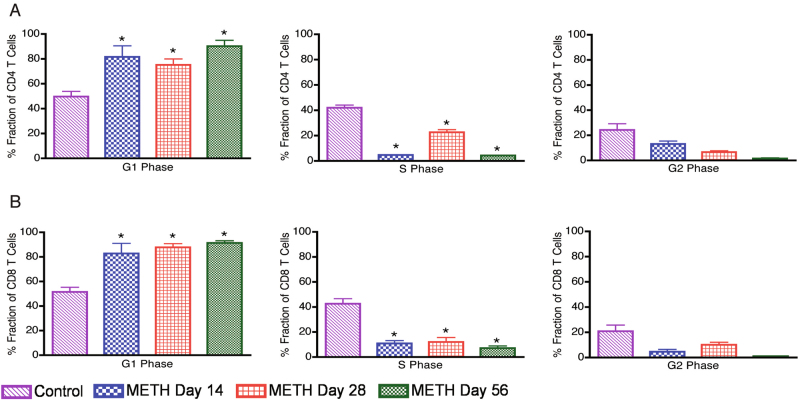
Fig. 6. Impaired cell cycle progression of CD4+ and CD8+ T cells in mice exposed to METH.
Splenocytes were stimulated with mouse anti-CD3/CD28 for 48 h to induce proliferation. After activation cells were stained with 7AAD and cell cycle data analysis was performed on CD4+ and CD8+ population. FlowJo Dean-Jett-Fox (DJF) cell cycle modeling algorithm was used to define the G1, S and G2 phases of the cell cycle. Results are representative of two different experiments from three mice per day. a Average values of % fraction of cells in respective phase in total gated CD4+ T-cell population. b Average values of % fraction of cells in respective phase in total gated CD8+ T-cell population. *P value < 0.05 compare to control mice

