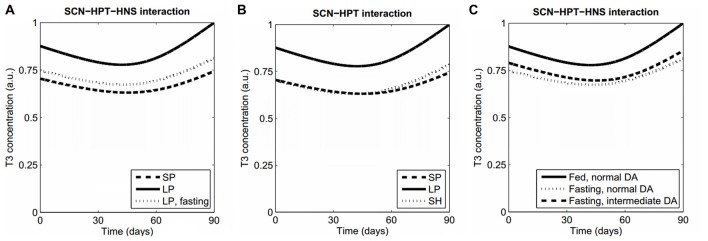
Figure 2.
Model features and predictions. (A) Our model qualitatively reproduces the lowering of T3 levels both in a SP and during fasting, as compared with LP levels. (B) Prediction 1. Keeping a LP in an artificially short Zeitgeber period (SH) will produce a winter T3 profile as in normal Zeitgeber period with a SP. (C) When fasting, higher concentrations of striatal DA will lead to normal T3 values. All simulations were performed with the same set of parameter values, except for those parameters that vary because of the proposed manipulations (Supplementary Table S1, Data Sheet 2).

