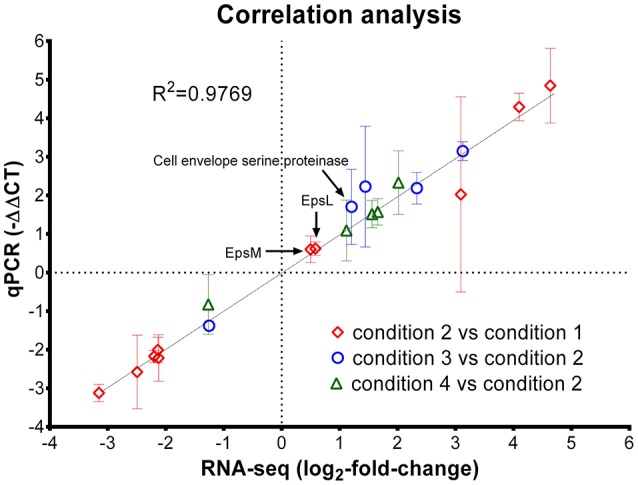
Figure 2.

Correlation analysis of gene expression level from RNA-seq analysis and reverse-transcriptase qPCR assay. Diamond, genes selected from the comparison of condition 2 and condition 1 (pH effect); Circle, genes selected from the comparison of condition 3 and condition 2 (temperature effect); triangle, genes selected from the comparison of condition 4 and condition 2 (WPI effect). The error bar (standard deviation) for -ΔΔCT (qPCR assay) was indicated; only the mean values for qPCR assay and RNA-seq results were used for linear regression analysis.
