Fig. 3.
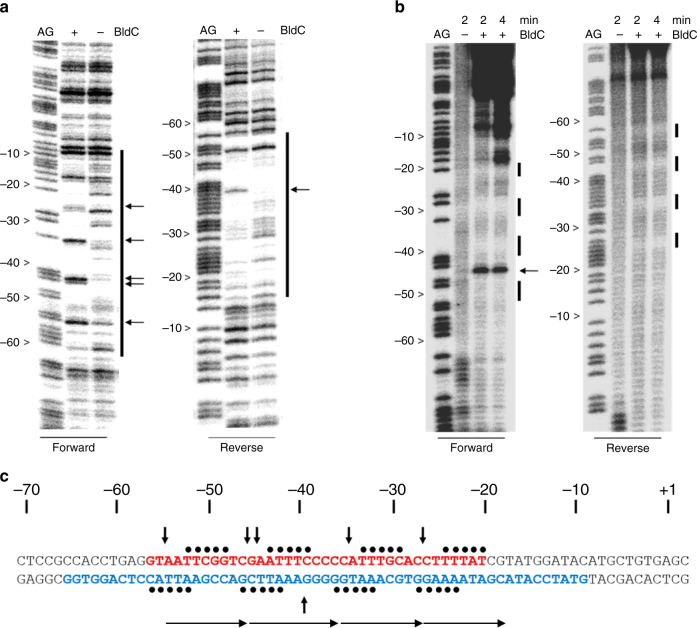
BldC binding to the smeA-ssfA promoter region. a DNase I and b hydroxyl radical footprinting analysis. 5′ end-labeled probes were incubated in the presence (1 µM) or absence of BldC and subjected to footprinting analysis as described in Methods. Footprints are flanked on the left-hand side by Maxam and Gilbert sequence ladders (AG). Horizontal black arrows indicate sites of enhanced cleavage and vertical bars indicate regions of DNase I protection. c Summary of the footprinting results presented in a and b. The filled black circles indicate the repeat pattern of bases protected from hydroxyl radical attack. The bases colored red and blue indicate the DNase I-protected sequences on the forward and reverse strands, respectively, and the vertical black arrows indicate the repeat pattern of DNase I hypersensitive sites seen on the top strand in the presence of BldC. The numbers indicate the distance to the 5′ end of the smeA transcript. Direct repeat motifs are indicated by head-to-tail arrows

