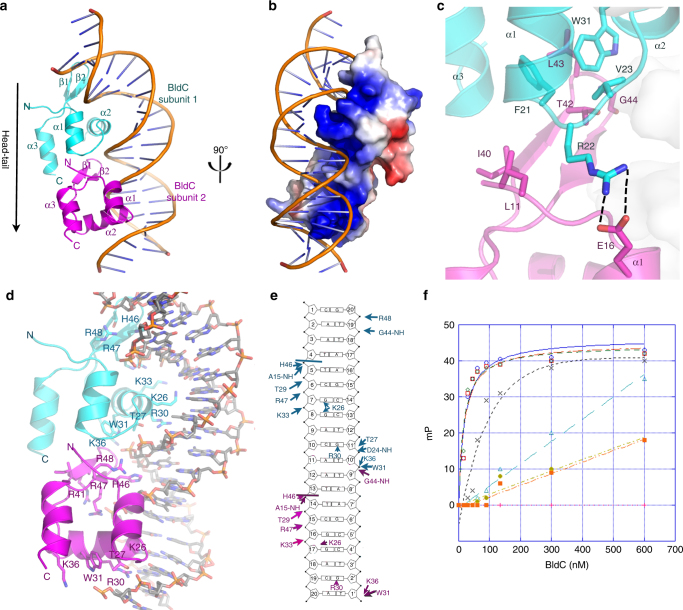
Fig. 4.
Structure of the BldC-whiI opt DNA complex. a Overall BldC-whiI opt structure with one BldC subunit colored cyan and the other magenta. The secondary structural elements are labeled. The head-tail directionality of BldC binding is indicated by an arrow. b Electrostatic surface representation of the structure rotated by 90° relative to a. Blue and red represent electropositive and electronegative regions, respectively. c Contacts important in BldC head-tail dimerization on the DNA. The side chains that mediate dimer formation are shown as sticks. The contacts between Arg22 and Glu16 from apposing subunits are shown as dashed lines. d BldC-DNA contacts. Residues that contact the DNA are shown as sticks and labeled. e Schematic ladder diagram showing the contacts between BldC and DNA. Note, for clarity, the 2 bp overhangs that are not contacted by BldC are not included. f FP binding isotherms of various BldC proteins binding to a fluorescently labeled whiI opt 22mer. Experiments were preformed in technical triplicate and the error between measurements noted. Shown are representative binding isotherms for WT His6-BldC (red squares), His6-Semet BldC(L43M-L58M) (green diamonds), Tag-free WT BldC (blue circles), His6-BldC(E16R) (black crosses), His6-BldC(G44E) (orange squares), His6-BldC(H46A) (light blue triangles) and His6-BldC(R30A) (yellow diamonds). The resulting Kds for these curves are 18.2 nM ± 4.8 nM, 19.6 nM ± 4.8 nM, 16.5 nM ± 4.0 nM, 140 nM ± 63 nM, no saturable binding (NB), NB and NB, respectively. The y-axis and x-axis are mP and BldC concentration (nM), respectively

