Figure 1.
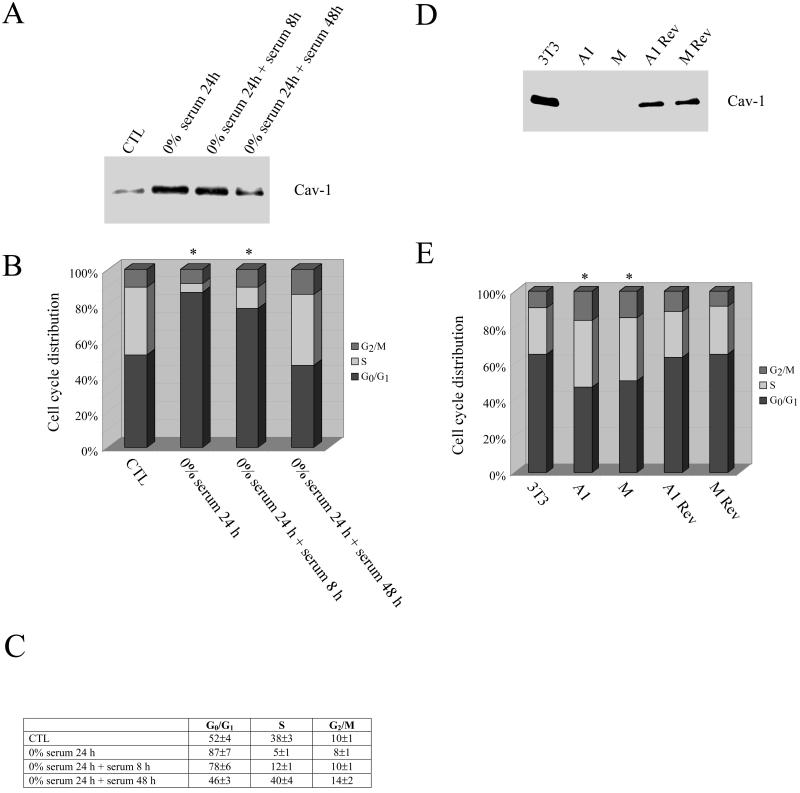
Endogenous caveolin-1 protein expression is up-regulated during the G0/G1 phase of the cell cycle. (A–C) Nontransfected NIH 3T3 cells were serum-starved for 24 h before the addition of serum for 8, 24, and 48 h. Each point was performed in triplicate. (A) Western blotting. Cell lysates were subjected to SDS-PAGE and Western blotting analysis with the use of a caveolin-1 specific mAb probe. A representative immunoblot is shown. Note that serum starvation up-regulates caveolin-1 protein expression, whereas the addition of serum to serum-starved NIH 3T3 cells causes a time-dependent reduction in caveolin-1 expression. Each lane contains equal amount of total proteins. (B) Cell cycle analysis. Cells were subjected to FACS analysis (in EXPERIMENTAL PROCEDURES). The cell cycle analysis shown represents the average from three independent experiments. Note that up-regulation of caveolin-1 protein expression is associated with a G0/G1 arrest. (C) Quantitation. Table representing the averages and SDs from the three independent experiments of the cell cycle analysis shown in B. (D and E) Parental NIH 3T3 cells, NIH 3T3 clones harboring caveolin-1 antisense (A1 and M), and revertant NIH 3T3 clones (A1 Rev, M Rev) were analyzed. (D) Western blot analysis. Cell lysates were subjected to SDS-PAGE and Western blotting analysis with the use of a caveolin-1-specific mAb probe (a representative immunoblot is shown; each lane contains equal amount of total protein). (E) Cell cycle analysis. Each point was performed in triplicate. A representative cell cycle analysis is shown. Note that the G0/G1 population is reduced when caveolin-1 expression is down-regulated. In B and E, the asterisk (∗) indicates significant differences in the cell cycle distribution.

