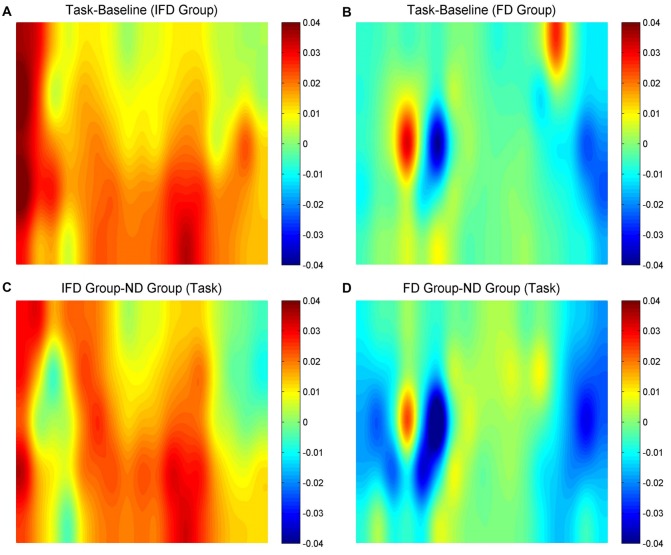
Figure 3.
The oxygenated hemoglobin (HbO) maps. (A,B) represent “the task conditions minus the baseline condition” of the IFD group and the FD group, (C) represents “the IFD group minus the ND group” in the task condition, and (D) represents “the FD group minus the ND group” in the task condition. The channel locations are the same as in Figure 2.

