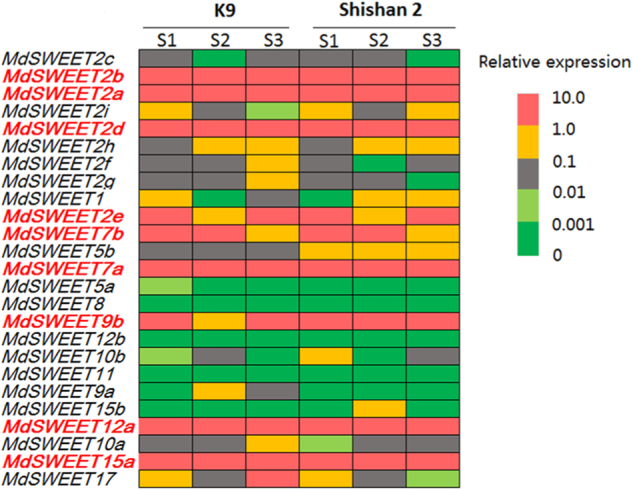
Fig. 3. Expression profiles of MdSWEETs in fruits of two cultivars K9 and Shishan 2 at different developmental stages.

The heat map was constructed based on relative expression levels of the MdSWEETs. S1, S2, and S3 represent young fruitlets, expanding fruits, and mature fruits, which were collected 30, 60, and 90 days after full bloom, respectively. The MdSWEET genes showing high expression throughout fruit development are highlighted in red color. The different colors represent different levels of gene expression, with the red color representing the highest values of gene expression, followed by yellow, gray, light green, and dark green
