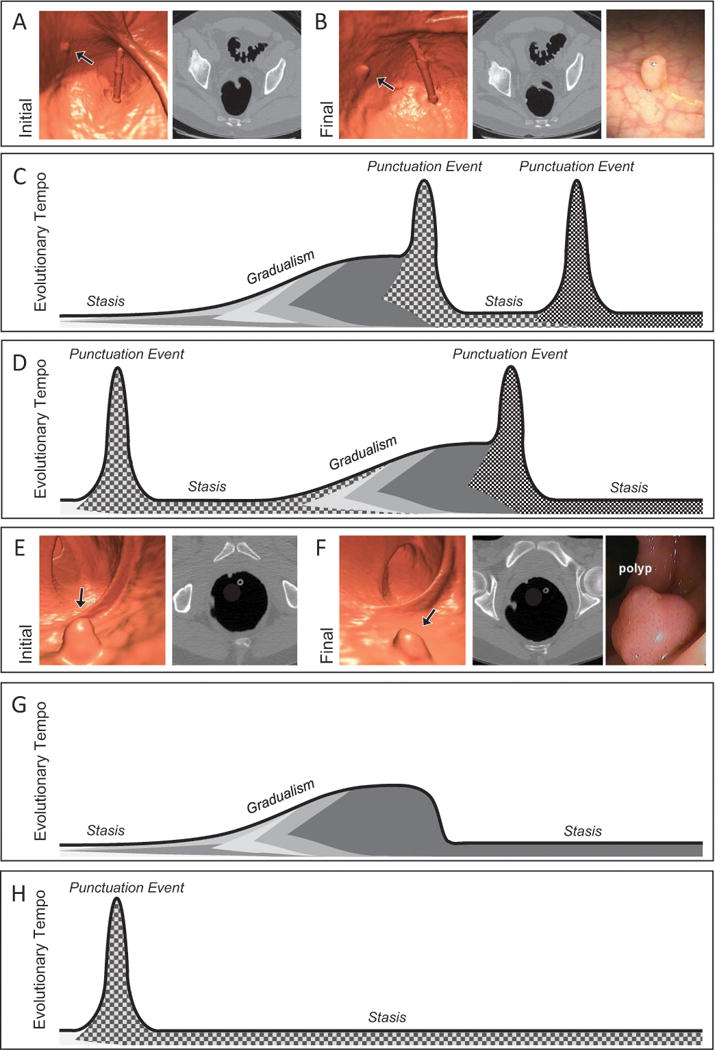
Figure 1.

The cancer punctuated equilibrium model of colon tumor evolution better explains the variability of colorectal polyp growth. Computed tomography colonography (CTC) images from the initial (A) and final (B) scans from a patient with polyp that had an annual volumetric growth rate of 59% that was followed over 2.1 years prior to polypectomy. Black arrows point to the polyp that was followed longitudinally. (C) and (D) are possible evolutionary trajectories for a growing polyp. Shading under the line represent levels of intratumoral heterogeneity with punctuation events creating the greatest amount of heterogeneity. Tumorigenesis may begin with a punctuation event or periods of stasis and gradualism, a second punctuation event may provide enough molecular diversity allowing for malignant transformation. (E) and (D) are CTC images from the initial and final scans from a patient with polyp that had an annual volumetric growth rate of −33% that was followed over 0.9 years prior to polypectomy. (G) and (H) are possible evolutionary trajectories for a regressing polyp. Tumor regression may occur with the emergence of a negative or immunogenic phenotype acquired during a period of gradualism or via a punctuation event.
