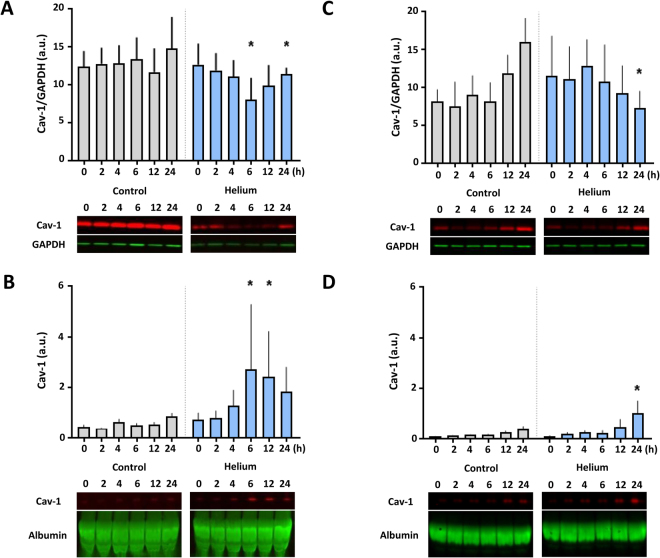
Figure 2.
Effect of helium on Cav-1 levels in HUVEC and HCAEC. Panel A: Western blot results of the cellular ratio of Cav-1 compared to GAPDH loading controls from different time points following helium or control gas treatment in HUVEC. Panel B: Western blot results of the supernatant ratio of Cav-1 compared to albumin loading controls from different time points following helium or control gas treatment in HUVEC. Panel C: Western blot results of the cellular ratio of Cav-1 compared to GAPDH loading controls from different time points following helium or control gas treatment in HCAEC. Panel D: Western blot results of the supernatant ratio of Cav-1 compared to albumin loading controls from different time points following helium or control gas treatment in HCAEC. Cropped images of representative Western blot results are displayed below the respective graphs. Full-length blots are presented in Supplementary Figs S5–S8. Data are represented as mean ± SD, *p < 0.05. HUVEC = human umbilical vein endothelial cells. HCAEC = human coronary artery endothelial cells.

