
Figure 6.
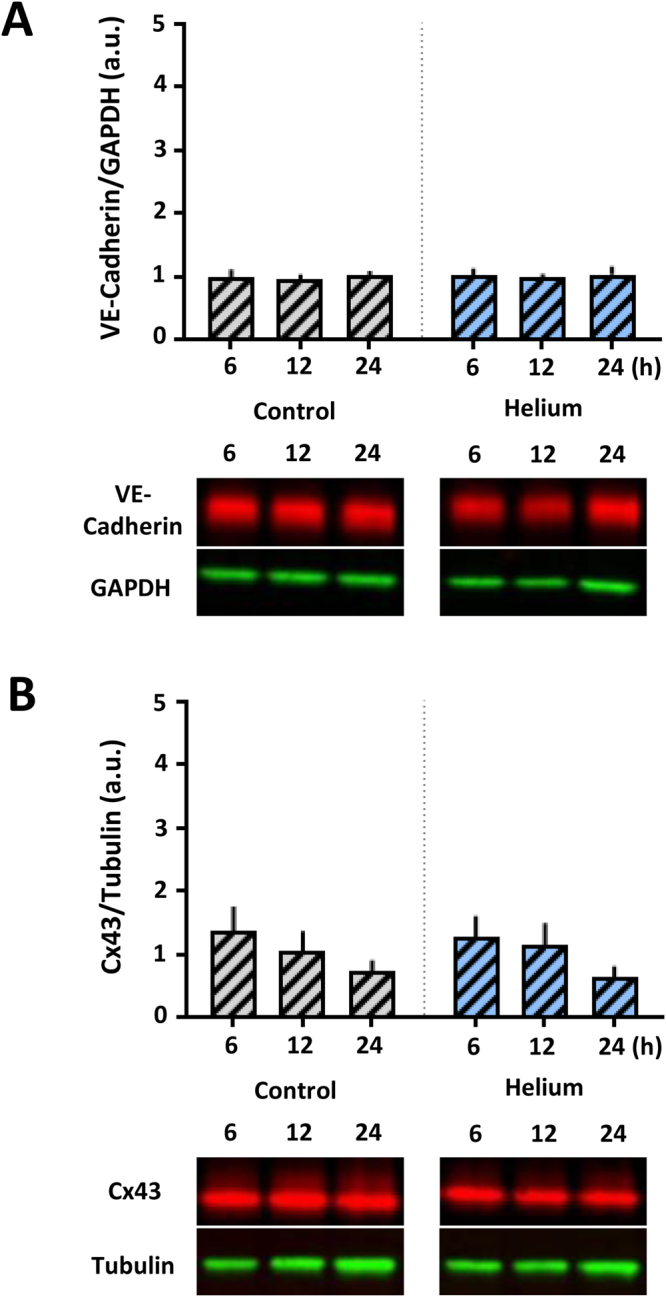
Effect of helium on VE-Cadherin and Cx43 in Cav-1 siRNA transfected HUVEC. Panel A: Western blot results of the ratio VE-Cadherin compared to GAPDH loading controls in Cav-1 siRNA transfected HUVEC at different time points following helium or control gas treatment. n = 7. Panel B: Western blot results of the ratio Cx43 compared to Tubulin loading controls in Cav-1 siRNA transfected HUVEC at different time points following helium or control gas treatment. n = 7. Cropped images of representative Western blot results are displayed below the respective graphs. Full-length blots are presented in Supplementary Figs S14–S15. Data are represented as mean ± SD, *p < 0.05. HUVEC = human umbilical vein endothelial cells.