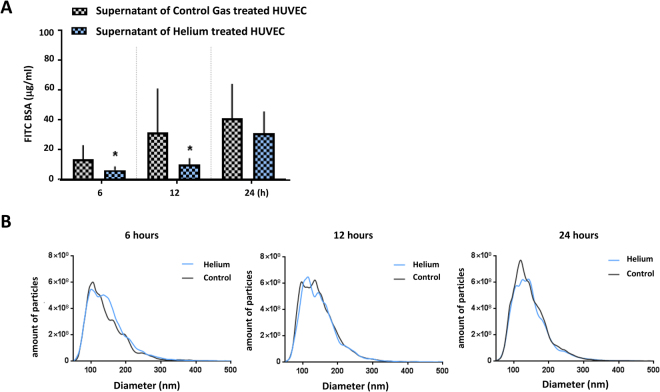
Figure 7.
Supernatant analysis. Panel A: Effect of incubation with supernatant of helium and control gas treated cells on HUVEC Results of permeability of a confluent monolayer of HUVEC, estimated by the transfer of FITC-BSA, in HUVEC treated with supernatant of helium treated HUVEC at different time points. Controls were treated with supernatant of control gas treated HUVEC. n = 10. Panel B: Results of nanoparticle tracking analysis of supernatant after helium and control gas treated HUVEC. Results of nanoparticle tracking analysis of supernatant after helium and control gas treated HUVEC at different time points. n = 4. Data are represented as mean ± SD for panel A, and means for panel B, *p < 0.05. HUVEC = human umbilical vein endothelial cells.

