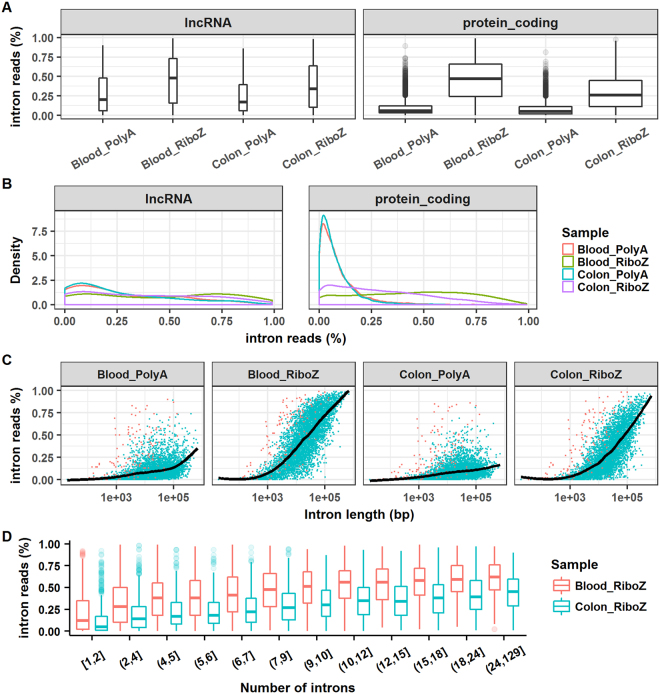
Figure 6.
Analyses of intron rate at the gene level. (A) Boxplots of intron rate for lncRNA and protein-coding genes. (B) Density plots of intron rate for lncRNA and protein-coding genes. (C) Relationship between intron rate and intron length. (D) Relationship between intron rate and the number of introns in a gene. The intron rate was calculated as follows. First, the number of reads mapped to intronic and exonic regions of individual genes were counted. Then, the intron rate was calculated by dividing the number of intronic reads by the sum of the numbers of intronic and exonic reads.

