Fig. 8.
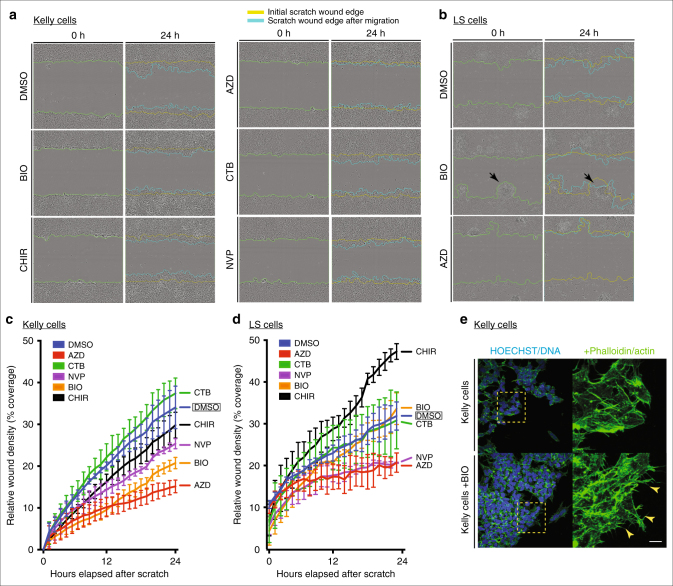
GSK3 and ALK inhibition affect migration in neuroblastoma cell lines. a, c Cell migration assay for Kelly neuroblastoma cell line. a Representative bright-field still images at start (t = 0 h) and end (t = 24 h) time points of the migration assay in Kelly cells under various GSK3 (0.5 μM BIO, 1.0 μM CHIR99021) and ALK inhibition treatments (1.5 μM CTB, 1.5 μM AZD-3463 and 1.0 μM NVP-TAE684). c Line graph representing the percentage of wound coverage over time. Notice that upon NVP-TAE684 (NVP) and BIO treatments cells do not close the wound as quickly as the control or unaffected CTB samples. AZD treatment showed the lowest percentage of wound coverage. b, d Cell migration assay for LS neuroblastoma cell line. b Representative bright-field still images at start (t = 0 h) and end time (t = 24 h) points of the migration assay in LS cells under GSK3 inhibition (0.5 μM BIO) and ALK inhibition treatment (1.5 μM AZD-3463). Note that upon BIO treatment LS cells tend to aggregate and expand into the wound (black arrows). d Line graph representing the percentage of wound coverage in LS cells. There is a tendency to increase migration upon GSK3 inhibition (BIO and CHIR). The lower wound coverage upon ALK inhibition treatment correlates with reduced population of cells at the end of the assay suggesting a compromise in cell viability under these conditions. e Representative images of actin staining (phalloidin, green) showing Kelly cells treated with BIO compared to controls. Notice the irregular spiky protrusions of cells where GSK3 is inhibited (yellow arrowheads). Scale bar, 25 μm

