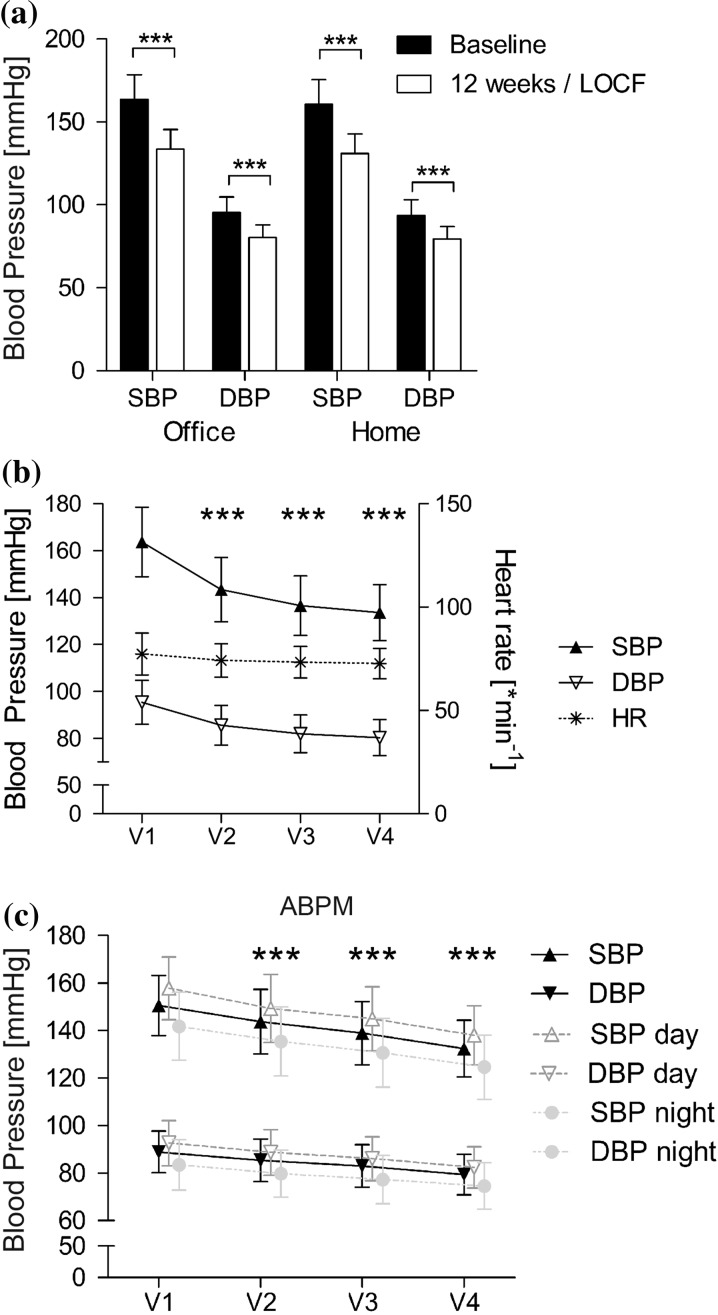
Fig. 2.
Change in systolic and diastolic blood pressure. a Total population, office vs. home measurements (n = 1770/1282, LOCF). b Systolic and diastolic office blood pressure and heart rate (HR) in the LOCF study population over time (n = 1770 for BP, n = 1680 for HR). c 24 h-ABPM measurements available in subset of patients (n = 187 for day, 175 for night, 167 for all measurements, LOCF). ***p < 0.0001 vs. V1 (baseline)

