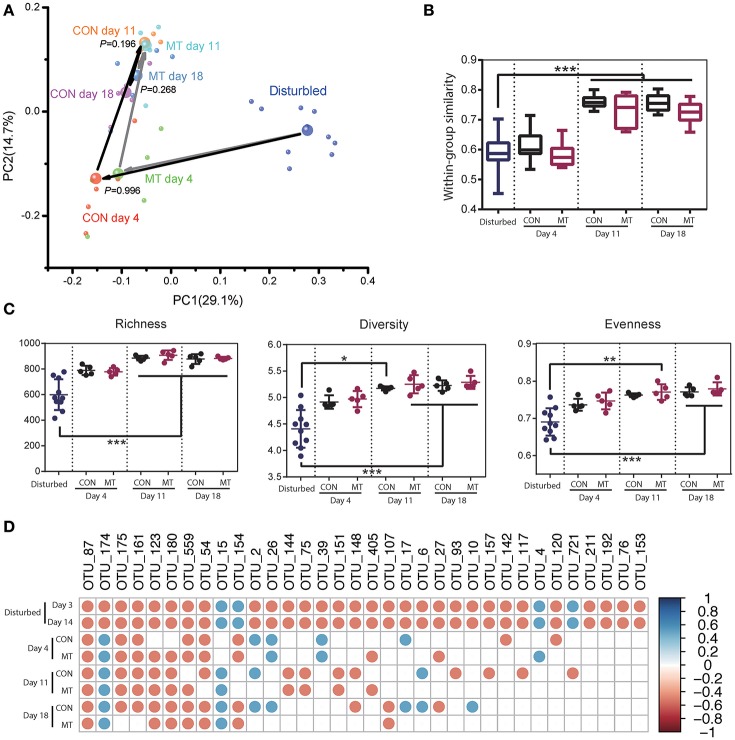
Figure 6.
Restoration of hindgut microbiota with or without microbiota transplantation. (A) Hindgut microbiota change for CON and MT groups in the first two dimensions of PCoA. Each small bubble represents one individual cow microbiota and big one represents the representative microbiota in each group. Arrows in dark represent the microbiota change for CON group and those in gray represent the microbiota change for MT group. Microbiota from CON and MT groups at same time point were compared with ANOSIM analysis. (B) Within-group similarities of hindgut microbiota in CON and MT groups changed over time. (C) Richness, diversity and evenness of hindgut microbiota in CON and MT groups change over time. (D) The restoration of antibiotic disturbed high-confidence OTUs in hindgut of CON and MT groups over time. All OTUs compared with those in pre-treated cows (Start group as shown in Figure 4); only significantly changed OTUs at both 3 and 14 days post antibiotics administration were shown; blue dots represent significant increase and red dots represent significant decrease. Data are expressed as mean ± s.d. *P < 0.1, **P < 0.05, ***P < 0.01.

