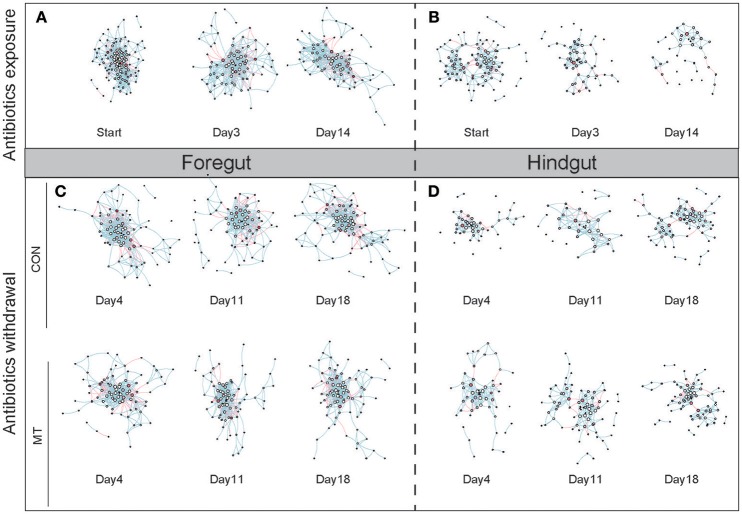
Figure 7.
The co-occurrence network change in foregut and hindgut after antibiotics exposure and antibiotics withdrawal. (A) The co-occurrence network change in foregut after antibiotics exposure. (B) The co-occurrence network change in hindgut after antibiotics exposure. (C) The co-occurrence network change in foregut after antibiotics withdrawal. (D) The co-occurrence network change in hindgut after antibiotics withdrawal. The nodes represented high-confidence OTUs in each sub-data sets, the size of each node represented the node degree value, the color of each node represented the node vulnerability value. The edge stands for significant correlation between two nodes (P < 0.001), the edge color represented negative (red) or positive (blue) correlation of two connected nodes.

