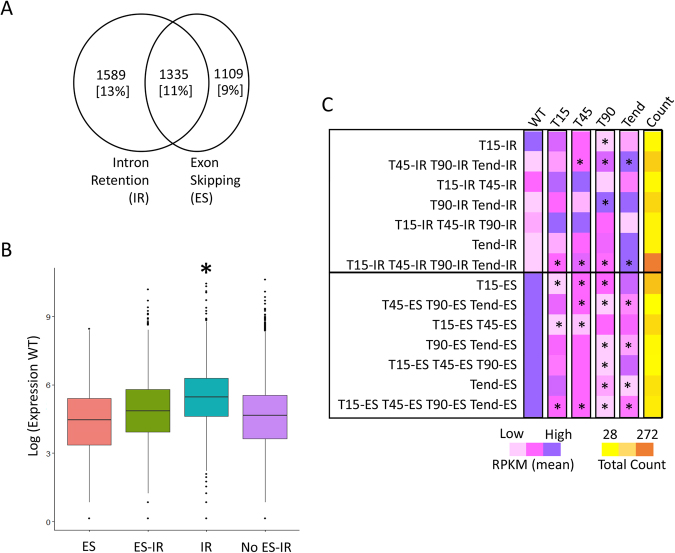
Figure 4.
Alternative splicing in P. tricornutum. The Venn diagram depicts (A) the number of genes predicted to undergo alternative splicing in the context of intron retention (IR) and exon-skipping (ES). Numbers and percentages (in square brackets) in the Venn diagram reflect the absolute number of genes and the relative percentage out of the total Phatr3 genes. (B) The box-plot represents the differences in expression of genes corresponding to different functional categories, represented on x-axis. Y-axis represents the expression of the genes in the wild-type (WT) (Biosample accession: SAMN06350643), scaled to log scale. (C) The heat-map compares the average expression of genes exhibiting intron-retention/exon-skipping (IR/ES) at different time-points (T15, T45, T90 and Tend) in Nfree culture conditions. For example, T15-IR row compares the average expression of all the genes exhibiting intron retention (IR) are time T15 across all the time-points. The last column represents the heat-map based on the number of genes in each category indicated on left Y-axis. *Indicates the level of significance as being significant (P-value < 0.05, two sample t-test with unequal variance) when the average expression of a particular sub-set is compared to the WT. Nfree in the figure denotes the culture condition with no source of nitrogen, WT denotes wild type or normal condition, T15 denotes RNAseq performed on cells sampled after 15 minutes of the culture, Similarly, T45, T90 and Tend denotes RNAseq libraries were prepared upon sampling the cells after 45 minutes, 90 minutes and 18 hours of culture, respectively.

