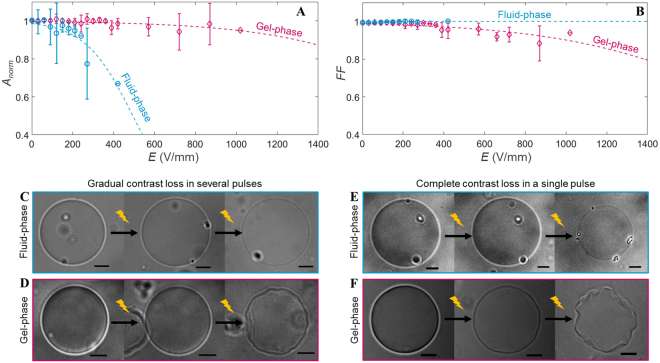
Figure 2.
The response of the fluid-phase (in blue) and gel-phase (in pink) GUVs to the electric field. (A) and (B) show, respectively, the averaged normalised area and form factor plotted versus the electric field of the pulse. The fluid-phase data is averaged over 11 different GUVs, with radii between 11 and 28 μm. The gel-phase data is averaged over 12 different GUVs, with radii between 10 and 22 μm. The error bars in the plots represent the standard deviation. The dotted lines represent the least-squares fit with a sigmoid curve. (C) and (D) are snapshots of the fluid-phase and gel-phase GUVs showing the gradual contrast loss. (C) From left to right: before pulse application, more than 100 seconds after the tenth pulse at 52 V/mm and after the twentieth pulse at 100 V/mm. (D) From left to right: before pulse application, more than 100 seconds after the fourth pulse at 74 V/mm and after the twenty-fourth pulse at 372 V/mm. (E) and (F) are snapshots of the fluid-phase and gel-phase GUVs showing the complete contrast after one of the pulses. (E) From left to right: before pulse application, more than 100 seconds after the second pulse at 89 V/mm and after the third pulse at 97 V/mm. (F) From left to right: before pulse application, more than 100 seconds after the third pulse at 595 V/mm and after the fourth pulse at 744 V/mm. The scale bar in all images is 10 μm.

