Figure 6.
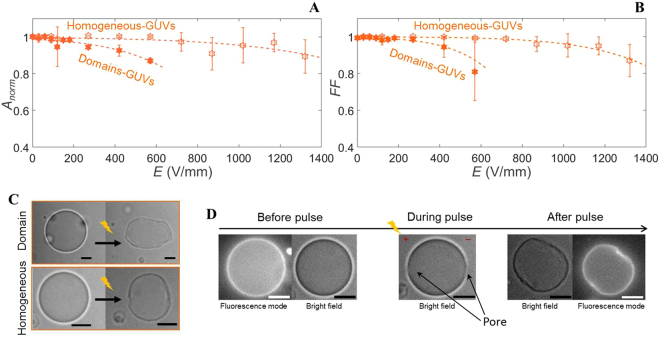
The response of the 8:2 DPPC:DPhPC GUVs to increasing electric pulses. (A) The averaged normalised area and (B) the form factor of the homogeneous- and domain-GUVs. The data is averaged over 13 different GUVs, with radii between 11 and 28 μm, where 7 GUVs contain domains (radius between 11 and 28 μm) and 6 GUVs have fully mixed phases (radius between 14 and 22 μm). The dotted lines represent the least-squares fit with a sigmoid curve. (C) The images of the domain- and the homogeneous-GUVs before and more than 100 seconds after the first pulse at 445 V/mm (domain-GUV) or the third pulse at 890 V/mm (homogeneous-GUV), respectively. (D) Bright field and fluorescence images of the homogeneous-GUV shown in (C) before the pulse, during the pulse when a macropore is observed, and after the pulse. The fluorescence images are only captured before and after the pulse. The scale bar is 10 μm.

