Fig. 3.
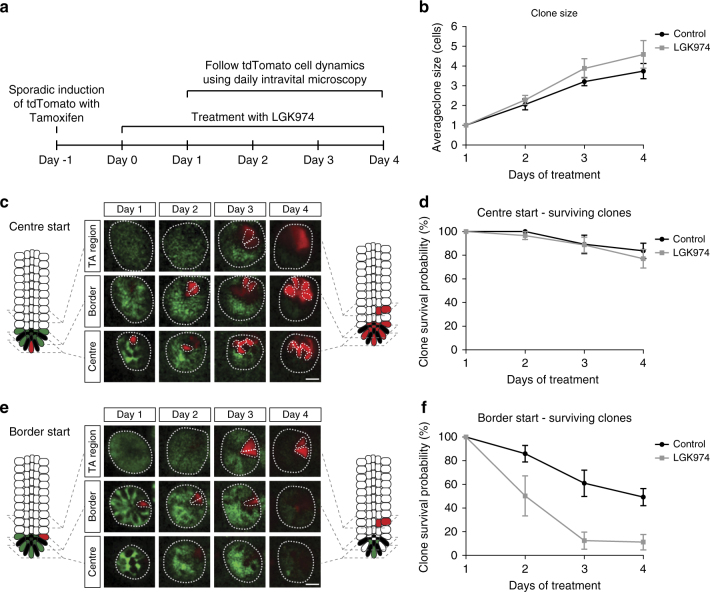
In vivo live imaging shows specific loss of border stem cells after LGK974 treatment. a Graphical representation of the experimental setup. One day before LGK974 treatment, Lgr5CreERtdTomfl mice were injected with 0.05 mg tamoxifen IP to induce recombination in single cells. Mice (N = 4) were treated with LGK974 and daily intravital imaging was performed starting 1 day after first LGK974 treatment and compared to control mice (N = 5). b Graph shows mean clone size (43 crypts, control; 56 crypts, LGK974 on day 1) of surviving clones (clones with at least one cell in centre or border) over time within the centre and border. Note that cells in the transit amplifying (TA) cell region are not counted. c, e Intravital images of the same crypt on days 1–4 following a clone starting in the centre (c) and a clone starting in the border (e). d, f Graphs show the percentage of clones that still have at least one cell in the centre or border starting from centre cell (17 crypts, control; 36 crypts, LGK974) (d) or from border cell (26 crypts, control; 20 crypts, LGK974) (f). Error bars = s.e.m. Scale bar, 20 µm

