Figure 1.
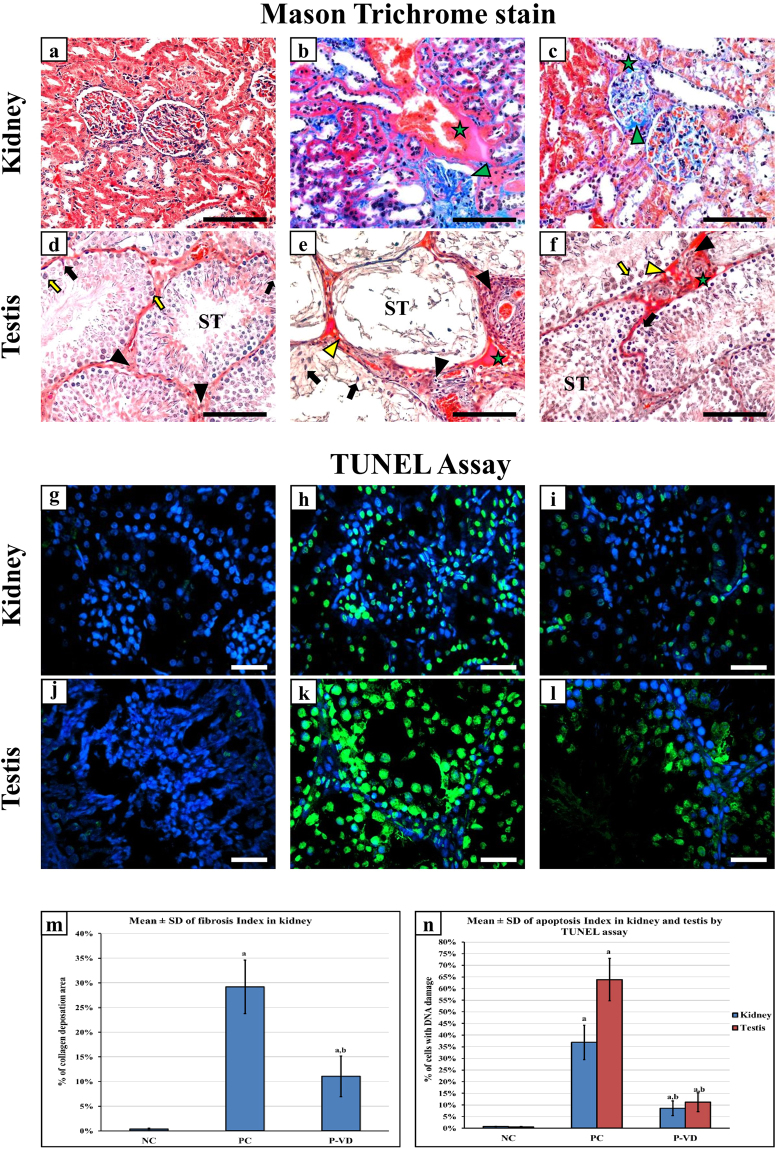
Histopathological features by Mason’s trichrome stain of renal and testicular tissues of the NC (a & d), PC (b & e), and P-VD (c & f) groups (40× objective, scale bar = 8 µm; green star = interstitial necrosis; green arrow head = collagen type I deposition in glomerulus; yellow arrow head = hyaline droplets; ST = seminiferous tubule; black arrow = Sertoli cell; black arrow head = Leydig cell and yellow arrow = spermatogonia). Cellular DNA damage was detected by TUNEL assay (Green fluorescent dye) in kidney and testis from the NC (a & g), PC (b & h), and P-VD (c & i) groups (40× objective; scale bar = 10 µm; positive nuclei are stained in green). Additionally, the renal fibrosis index (m) and renal and testicular apoptosis/necrosis index (n) are shown as bar graphs for the study groups. (a = P < 0.05 compared with NC group and b = P < 0.05 compared with PC group).

