Figure 1.
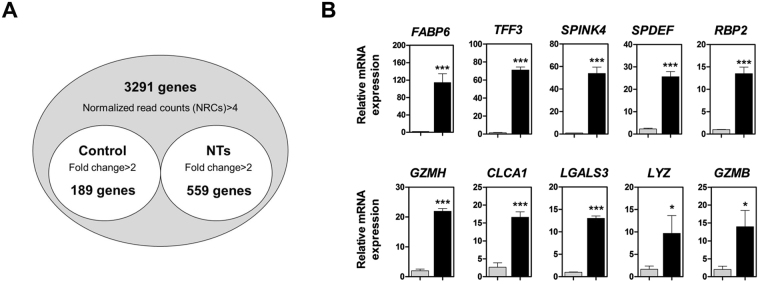
Gene expression profiling of the small intestine after dietary treatment with NTs for 14 days. (A) Venn diagram illustrations of genes found to be differentially expressed with or without NT treatment in the small intestine. The common genes from quanti-seq experiments were upregulated at least 2-fold (P < 0.05). (B) Quantitative expression analysis of genes that were highly expressed following NT treatment in the small intestine (n = 3). Real-time PCR analysis was conducted in triplicate and normalized to the expression levels of glyceraldehyde 3-phosphate dehydrogenase (GAPDH). Significant differences between control and treatment groups are indicated as ***P < 0.001, **P < 0.01, and *P < 0.05. Error bars indicate standard errors (SEs) of triplicate analyses.

