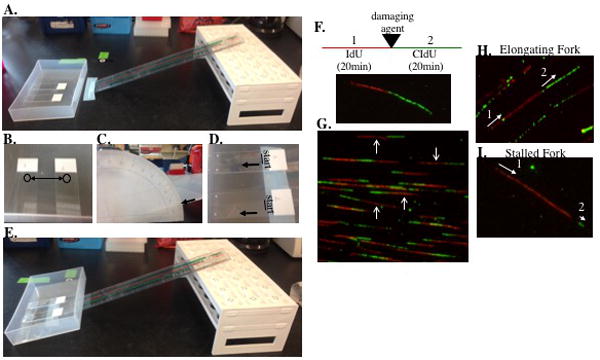
Figure 7.

A. An image of our setup for the lysis step in the DNA fiber assay through to spreading the DNA fibers onto the slides. The slides are in a container that will sit flat and even on bench. The ruler and rack (turned upside down) serves as a platform for tilting the slides in the container to a 15° angle after lysis. B. An image of slides with 2μL of cells spotted at the top of the slide. C, E. After lysis, the container is moved up the ruler until the bottom edge of the container (corresponding to the bottom of the slides) reaches a 15° angle. D. The lines at the top of the slide mark the start of the DNA fibers and the arrows indicated the movement of the DNA fibers as they move down the slide. This is a critical step in the DNA fiber assay. How the fibers move down the slide will significantly impact the quality of images for analysis. Slide the container holding the lysed cells slowly up the ladder (or whatever you use to make an angled surface) watching the movement of the fiber solution carefully. The fibers should spread slowly down the slide. If the fiber solution is moving down the slide rapidly, lower the angle to a 10° angle or until the movement is slowed. F. A schematic of the experiment and an image of a representative DNA fiber with incorporation of IdU in the first pulse (which is red in the image) and then incorporation of CIdU in the second pulse (which is green in the image). To measure the effect of a damaging agent on fork progression or fork collapse, the cells are treated with a damaging agent after the first pulse with IdU. G. A representative image with well separated, elongating fibers. The arrows indicate a few of the elongating fibers in the image that can be used to measure mean tract length. H. A representative image of an elongating fiber indicating the progression of replication. 1-labels the first pulse with IdU then two-labels the second pulse with CIdU. Therefore, replication was moving from left to right in this fiber. I. A representative image of a stalled replication fork. IdU is incorporated during the first pulse, however CIdU is not incorporated or there is initial incorporation without continuation (as seen in this image). Elongating replication forks can be used to measure mean tract length. Replication structures, including elongating and stalled forks, can also be scored.
