
Extended Data Figure 1. Sound frequency tuning in AC neurons.
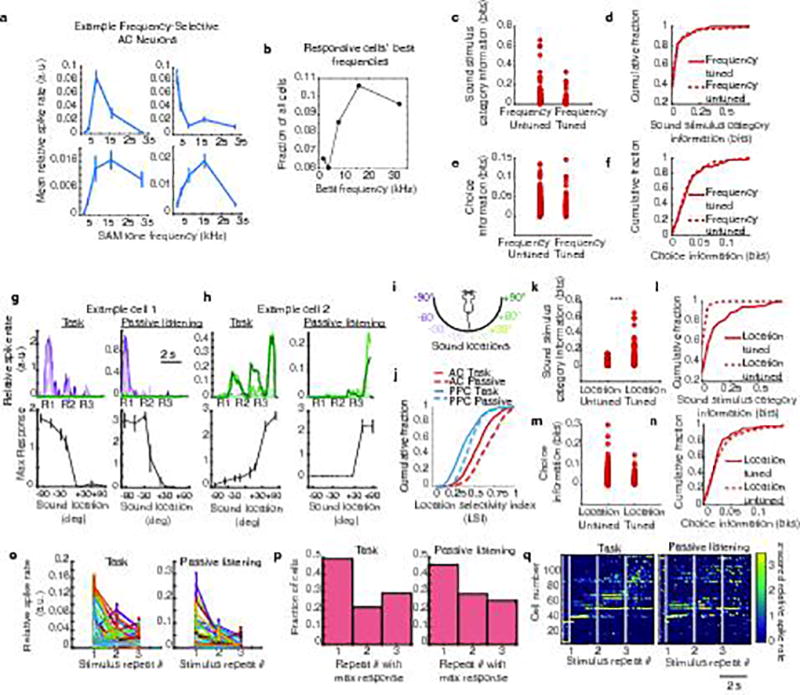
a, Mean responses (maximum relative spike rate across the 1 s sound presentation) to sinusoid amplitude-modulated (SAM) pure tones in example AC neurons. SAM tones were presented to passively listening mice after the task. b, Histogram of sound responsive cells’ best frequencies, the frequency of the maximum response for each neuron (unresponsive neurons were not included). c–f, Information about the sound stimulus category and the mouse’s choice in the task were compared between neurons that were untuned or tuned for sound stimulus frequency as measured in a. Significant tuning was defined by comparing the frequency selectivity index (ymax-ymean)/(ymax+ymean), where ymax is the mean response to the best frequency, and ymean is the mean response to the other frequencies, to the frequency selectivity index calculated with shuffled trial identities. Frequency-tuned and untuned neurons did not contain significantly different amounts of information about the stimulus category or choice in the task (p > 0.5, rank sum test). g–h, In a subset of imaging experiments (n = 3), we played the same sound location stimuli as in the task, in a similar repeating pattern as mice experienced during task trials (three consecutive stimulus repeats). Trial-averaged responses to sound location stimuli measured during the task (left) and during passive listening (right) contexts. Line colors indicate the sound location (see panel i). (Bottom row) Tuning curves measured as the average maximal relative spike rate during the sound presentation at each sound location in task (left) and passive (right) contexts. i, Sound location color legend, applies to g,h. j, Cumulative distributions of sound location selectivity indices (LSI: (ymax-ymean)/(ymax+ymean), where ymax is the mean response to the best location, and ymean is the mean response to the other locations) measured in AC and PPC neurons during the task (solid lines) and passive listening (dashed lines). AC cells had significantly higher LSIs than PPC cells (p < 0.001, rank sum test), and AC cells had significantly higher LSIs in the passive context than the active context (p < 0.001, signed rank test). k, Sound stimulus category information during the task in neurons untuned or tuned for sound location, determined by comparing LSIs in real and shuffled data during passive listening. Neurons with significant sound location tuning had more information about the sound location stimulus category (left vs right), p < 0.001, rank sum test. l, Cumulative distributions of sound category information for neurons tuned and untuned for sound location (using LSI significance). m, Choice information in neurons untuned or tuned for the sound location. n, Cumulative distributions of choice information for neurons tuned and untuned for the sound location (using LSI significance). Location-selective neurons had similar distributions of choice information (p > 0.5, rank sum test). o, Mean response of all neurons across each stimulus repeat during the task (left) and passive (right) contexts. Error bars indicate mean ± sem. Responses to sound repeat 1 tended to be higher than responses to repeats 2 and 3 (p < 0.001, signed rank test). p, Histograms of the stimulus repeat during which cells had their maximal responses during task (left) and passive listening (right) contexts. q, z-scored, trial-averaged activity of all AC neurons with 3 stimulus repeats in the passive context, sorted by time of peak mean activity and aligned to the time of the first sound onset. Responses during the task (left) and passive listening (right) were sorted by the time of peak response during the task. White vertical lines show the onset times of the first, second, and third sound stimulus repeats. Task trials with more or fewer than three repeats were excluded. The overall temporal pattern of activation across the AC population appeared similar in the two contexts, with a subset of neurons responding during the first sound stimulus presentation, and other neurons responding later, with some responses appearing to depend on subsequent sound stimulus repeats. Many neurons did not appear obviously responsive to the sound stimuli used in the task.