
Extended Data Figure 3. Choice probability and behavioral relevance of sensory information.
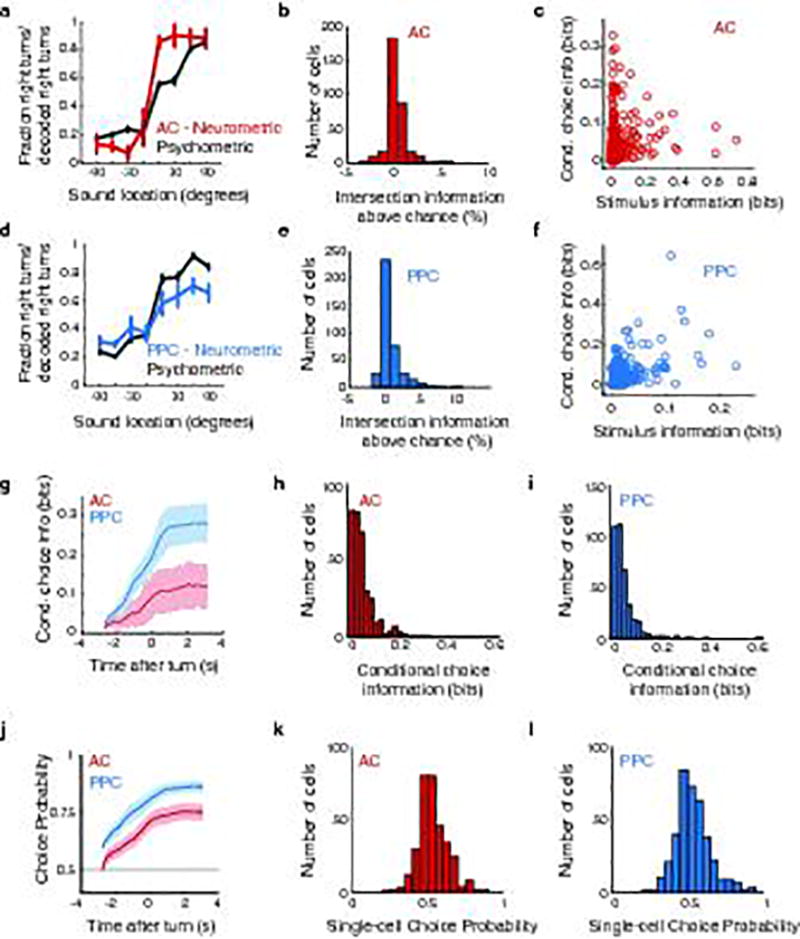
a, Red: AC neurometric curve computed from the performance of a sound location decoder (Supplementary Information). Dark gray: psychometric curve for mice from AC imaging sessions. Session-averaged psychometric and neurometric curves were positively correlated (r = 0.93, p < 0.001). b, Intersection information (II) above chance levels in AC neurons. The amount of II per cell above chance level was 0.2% ± 0.1% in AC (larger than zero with p < 0.0001, paired signed-rank test) and 0.7% ± 0.2% in PPC (p < 0.0001, paired signed-rank test). c, Conditional choice information plotted against stimulus information for all single AC cells. Stimulus information was computed without discounting the correlation between stimulus and choice (Spearman r = 0.33, p < 0.001; Supplementary Information). d–f, Same as a–c, except for PPC. d, Session-averaged psychometric and neurometric curves were positively correlated (r = 0.99, p < 0.001). e, Intersection information (II) above chance levels in PPC neurons was 0.7 ± 0.2 (p < 0.0001, paired signed rank test). f, Spearman r = 0.43, p < 0.001. g, Cumulative conditional choice information, computed by the performance of a choice decoder that assumes knowledge of all GLM predictors not directly related to choice (Supplementary Information). Cumulative conditional choice information was significant in both AC and PPC (AC: p < 0.05, PPC: p < 0.001, one-tailed t-test on the value of the choice information at the moment of the turn). Red: AC, blue: PPC. h–i, Total single-cell conditional choice information, computed as the maximum of the cumulative conditional choice information for each cell in AC and PPC. j–l, Same as g–i, quantifying the performance of the conditional choice decoder as a model-based choice probability19. j, Population choice probability was significantly larger than 0.5 in both AC and PPC at the last aligned time frame (p<0.001, one-tailed t-test). k, Mean single-cell choice probability 0.537±0.005 (larger than 0.5, p < 0.001, t-test). l: Mean single-cell choice probability 0.536±0.006 (larger than 0.5, p < 0.001, t-test).