
Extended Data Figure 4. Decoder Controls.
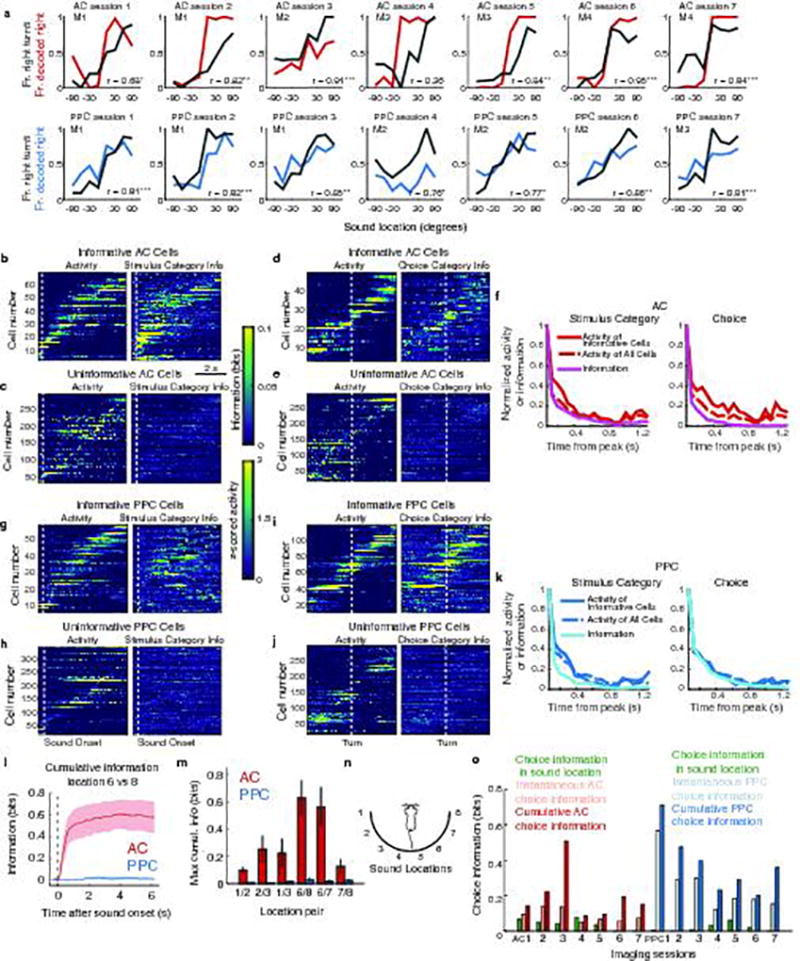
a, Gray: behavior performance during single imaging sessions used in all analyses. Overall behavior performance did not correlate with the number of choice selective neurons in the AC (r = −0.34, p > 0.1) or PPC (r = 0.38, p > 0.1) populations. Red, blue: single-session neurometric curves a sound location decoder (same as in Extended Data Fig. 3a, d; Supplementary Information). Inset in each panel reports the correlation coefficient between the neurometric and psychometric curves. * indicated p < 0.05; ** p < 0.01; *** p < 0.001; one-tailed test with null hypothesis that correlation is not higher than chance. b, (left) z-scored trial-averaged activity of all AC neurons with > 0.06 bits of stimulus information, sorted by time of peak mean activity, aligned to trial events as in (Fig. 1d,e). (right) Instantaneous stimulus category information in the same neurons. Time scalebar below panel on the right applies to all panels b–e and g–j. c, (left) z-scored, trial-averaged activity of all AC neurons with ≤ 0.06 bits of stimulus information. (right) Instantaneous stimulus category information in the same neurons. d, (left) z-scored, trial-averaged activity of all AC neurons with > 0.06 bits of choice information, sorted by time of peak mean activity. (right) Instantaneous choice information for the same cells. e, (left) z-scored, trial-averaged activity of all AC neurons with ≤ 0.06 bits of choice information, sorted by time of peak mean activity. (right) Instantaneous choice information for the same cells. f, Information about stimulus category (left, magenta) and choice (right, magenta) averaged across all AC neurons with at least 0.06 bits of information, as a function of the time from the peak. Normalized, aligned activity in all cells (dashed line) and informative cells (solid red line) are superimposed. g–k Same as b–f, for PPC cells. l–n, Information about the exact location of the sound stimulus. l, The cumulative population decoder was used on subsets of trials from only two sound locations such that there were equal numbers of trials from each location and no other locations were present. The data are shown for a comparison of locations 6 and 8. Note that locations 6 and 8 are part of the same category and indicate the same correct choice in the task. m, Maximum cumulative information calculated as in (l) for other location pairs that belong to the same stimulus category (left or right). All imaging experiments were performed in the left hemisphere, and so AC had higher information about contralateral sound stimulus locations. Error bars indicate mean ± sem. n, Diagram showing the sound location arrangements for location pairs compared in decoders in (l–m). o, Choice information in all datasets. Green bars: choice information that can be extracted from sound location due to an uneven distribution of errors across sound locations. This was a concern because more errors occurred at sound locations close to the midline (Fig. 1c), and perhaps location tuning could lead to an aberrant choice information measurement. Light red (AC) and light blue (PPC): maximum instantaneous choice information in neuronal population activity. Dark red (AC) and dark blue (PPC): total cumulative choice information in neuronal population activity. The uneven distribution of error trials across sound locations was not sufficient to explain choice information in AC or PPC.