
Extended Data Figure 5. Coupling and Pearson correlations across contexts.
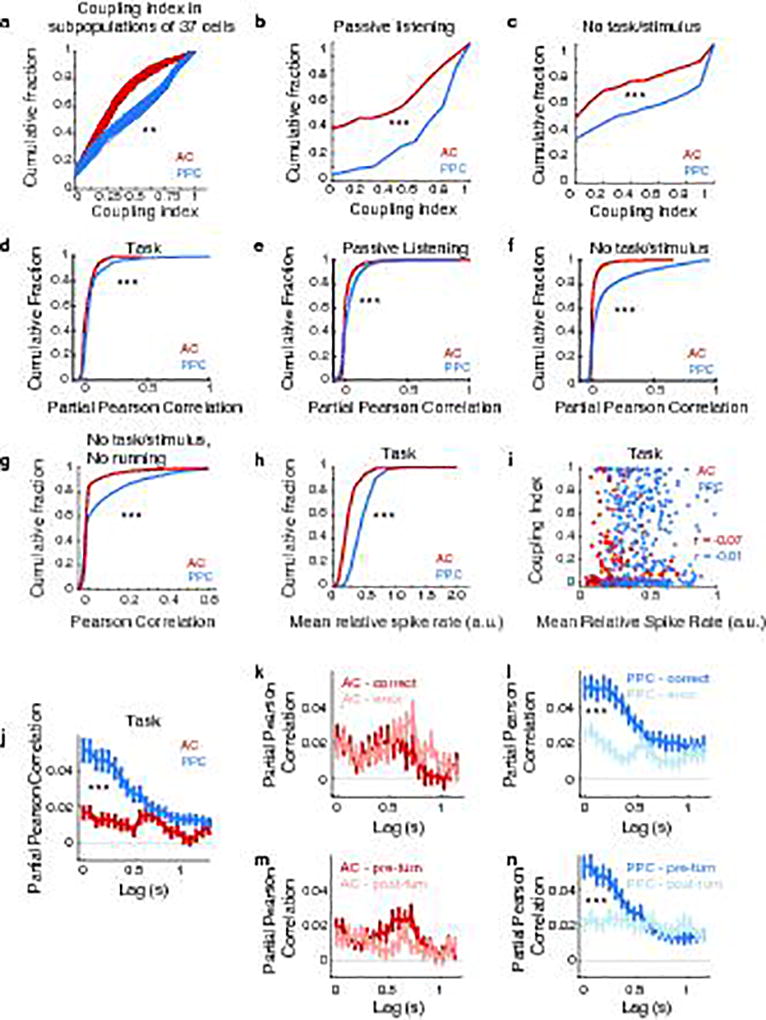
a, The coupled model was fit using random subpopulations of 37 neurons (the number of neurons in the smallest dataset) 100 times in all AC and PPC datasets. Cumulative distributions of performance of the coupled model using all subsamples of AC (red) and PPC (blue) datasets show that all PPC datasets still had greater coupling than all AC datasets (p < 0.01, rank sum test), even when using smaller numbers of neurons. b–c, Cumulative distributions of the coupling index in AC (red) and PPC (blue), measured during passive listening and the “no task/stimulus” context. d, Cumulative distributions of partial Pearson correlations (Methods) during the pre-turn period of the task in AC (red) and PPC (blue). Consistent with the higher coupling indices measured in PPC (Fig. 3d), correlations were higher in PPC than AC (p < 0.001, KS test). e, Cumulative distributions of partial Pearson correlations during passive listening to the stimulus sets used in the task in AC (red) and PPC (blue) datasets. PPC was more correlated than AC even when the mouse was not engaged in a task (p < 0.001; KS test). f, Cumulative distributions of partial Pearson correlations measured in the “no task/stimulus” context in AC (red) and PPC (blue). Again, PPC was more correlated than AC, in the absence of task or sound stimulus presentations (p < 0.001, KS test). g, Cumulative distributions of Pearson correlations measured in the “no task/stimulus” context when the mice were stationary (not running) on the ball (AC vs. PPC: p < 0.001, KS test). h, Cumulative distributions of mean relative spike rates in AC (0.24 ± 0.14 a.u., mean ± sem) and PPC (0.45 ± 0.18 a.u.). AC vs. PPC: p < 0.001, KS test. i, Coupling index vs. mean relative firing rate measured during the pre-turn period of the task. Each dot is one neuron. Because coupling and firing rate were not positively correlated (AC: r = −0.020; PPC: r = 0.007; p > 0.25), it is unlikely that higher firing rates in PPC caused an artefactual increase in correlation and coupling relative to AC. j, Partial Pearson correlations, computed across trials for time lags spanning 0 to over 1 s in AC (red) and PPC (blue), over all data, during the task. *** indicates p < 0.001, rank-rum test on the average Partial Pearson correlation across lags smaller than 0.5s. k, Partial Pearson correlations in AC populations, computed separately for correct (red) and error (pink) trials, for pre-turn data. l, Same as k, for PPC (dark blue: correct trials, light blue: error trials). *** indicates p < 0.001, rank-sum test on the average partial Pearson correlation across lags smaller than 0.5 s. m, Partial Pearson correlations in the pre-turn (red) and post-turn (pink) trial epochs in AC populations. n, Same as m, for PPC. *** indicates p < 0.001, rank-sum test on the average partial Pearson correlation across lags smaller than 0.5 s.