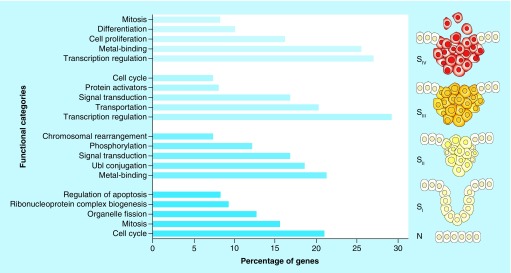
Figure 1. . Top five functional categories (categories with p-value < 0.05 containing at least 10 genes) that significantly enriched for each DEG list.
The right schematic representation of colon cancer progression is based on a model from Fearon and Vogelstein [26].
DEG: Differentially expressed gene; N: Normal stage; SI: Stage 1; SII: Stage 2; SIII: Stage 3; SIV: Stage 4.

