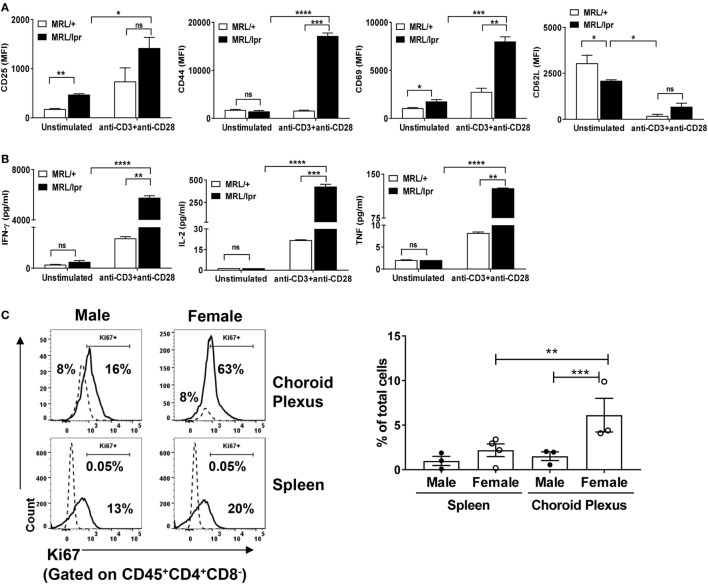
Figure 2.
Brain infiltrating T cells are activated. Sorted CD4+ T cells from choroid plexuses of 16–18-week-old female MRL/+ (n = 3) and MRL/lpr (n = 5) were stimulated in vitro with anti-CD3 and anti-CD28. (A) Cells were analyzed for the expression of T cell activation markers: CD25, CD44, CD69, and CD62L. (B) Culture supernatants were analyzed for the quantification of different cytokines by LEGENDplex. Bars represent mean ± SEM of duplicate wells, and the statistical significance was determined by the Holm-Sidak method with alpha = 0.05. (C) CD45+CD4+CD8− T cells from choroid plexus and spleen were stained for the expression of Ki67 (solid lines). Isotype control (dotted lines) were used to set positive and negative gates. Values in the histogram indicate percentage of parent (CD4) cells (left panel). The right panel shows the cumulative data depicting the percentage of Ki67+ in the total number of cells from spleen and choroid plexus of male (n = 3) and female (n = 3–4) mice. Data are represented as mean ± SEM of percentage of total cells. Each dot represents one mouse. p-Values were determined by one-way ANOVA. The p-values were calculated with an unpaired t-test. *p < 0.05, **p < 0.01, ***p < 0.001.

