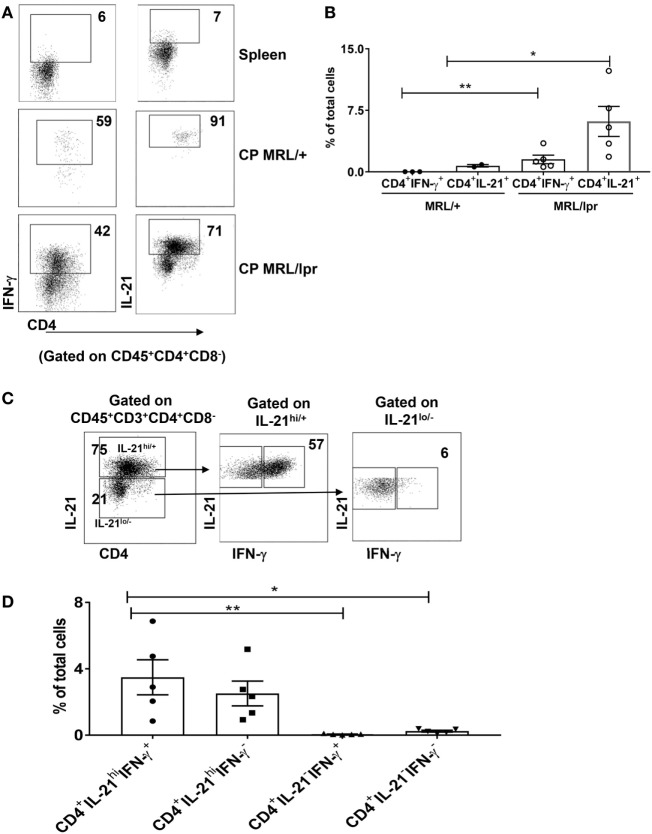
Figure 3.
T cells infiltrating the brain predominantly secrete IFN-γ and IL-21. (A) Single cell suspensions from choroid plexus (CP) of 16–18-week-old female MRL/+ (n = 2–3) and MRL/lpr (n = 5) mice were stimulated with PMA and ionomycin for 6 h, and stained for intracellular IFN-γ and IL-21. Values in the FACS plots represent percentage of parent (CD4+) population. (B) Bars represent mean ± SEM of the percentage of CD4+ IFN-γ+ cells and CD4+ IL-21+ cells from the total number of cells in the CP. (C) FACS plots showing relative expression of IFN-γ in IL-21hi and IL-21lo/neg cells. Values indicate percentage of parent population (indicated above each plot). (D) Graphs depict mean ± SEM of the percentage of CD4+IFN-γ+IL-21+, CD4+IFN-γ−IL-21+, CD4+IFN-γ+IL-21−, and CD4+IFN-γ−IL-21− cells in the total number of cells in the CP of MRL/lpr mice. Each dot represents one mouse. PD1 and CXCR5 negative spleen T cells were used to set the negative gates for IFN-γ and IL-21 in this figure. The p-values were determined by unpaired two-tailed t-test with Welch’s correction. *p < 0.05, **p < 0.01.

