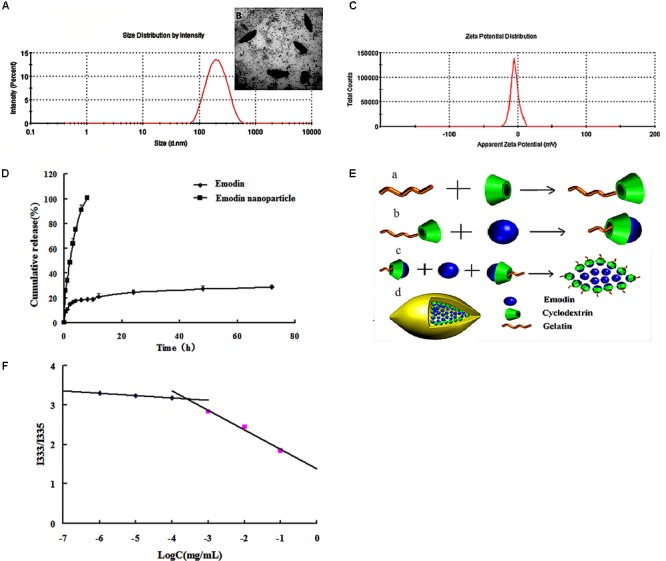
FIGURE 2.

Characterization of emodin nanoparticles. (A) Particle size distribution of emodin nanoparticles. (B) TEM image of emodin nanoparticles. (C) Zeta potential of emodin nanoparticles. (D) In vitro release profiles of emodin and emodin nanoparticles in PBS (pH 7.4, 30% ethanol). (E) The formation of emodin nanoparticles. (a) Synthesis of Gel-CD copolymer. (b) The host–guest interaction between the emodin and β-CD in the Gel-CD copolymer. (c) The self-assembly of emodin nanoparticles. (d) The structure of emodin nanoparticles. (F) The CMC of Gel-CD copolymer.
