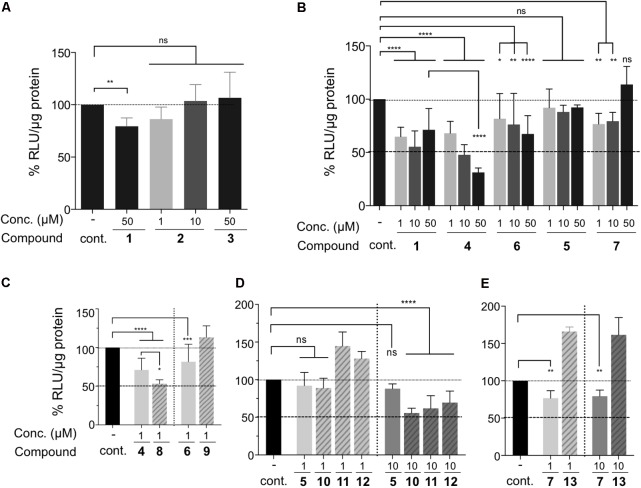
FIGURE 4.
Inhibition efficacy of drugs on HTLV-1 cell-to-cell transmission. (A–E) Luciferase activity was normalized to protein concentration (in μg, quantified by Bradford assay) and expressed as percent of untreated (control) cells set as 100%. Drug concentrations and drug names are indicated. Results were grouped based on the drug family: (A) AZT (1), 3TC (2) and d4T (3) nucleoside analogs, (B) AZT (1) and acyclic nucleoside phosphonates, (C) PMEA and S-PMEA and their prodrugs, (D) PMPA and a series of PMPA pro-drugs, (E) S-PMPA and its pro-drug. Statistical differences were determined using one-way ANOVA (ns, not significant, ∗p < 0.05, ∗∗p < 0.01, ∗∗∗p < 0.001, ∗∗∗∗p < 0.0001, n = 2–4 independent experiments with triplicate samples).

