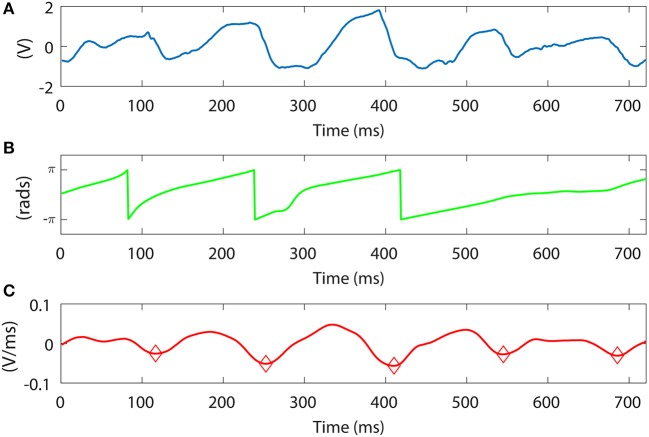
Figure 10.
Signal slope and Hilbert transform phase comparison. (A) Unipolar signal. Bottom. Unipolar signal slope approximation for different window length values, M in ms. (B) Hilbert transform phase applied to the signal in (A). (C) Unipolar slope approximation applied to the signal in (A), M = 30 ms. Red circles denote the LATs calculated with our method.

