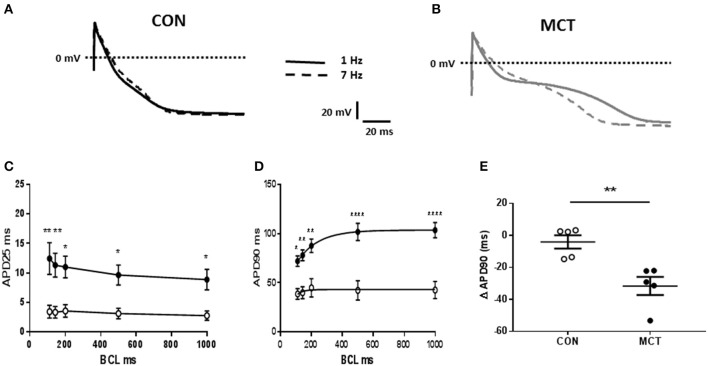
Figure 2.
Representative APs from (A) CON and (B) MCT RV myocytes at stimulation frequencies of 1 and 7 Hz (dashed lines) (C) APD25 restitution curves (D) APD90 restitution curves for CON (°) and MCT (•) myocytes (E) change in APD90 from stimulation frequencies of 1–9Hz. Increasing stimulation frequency caused a larger fall in APD90 in MCT than CON myocytes. n = 5 CON and 5 MCT myocytes ****P < 0.0001, **P < 0.01, *P < 0.05 CON vs. MCT (C,D) two way RM ANOVA, (E) unpaired t-test.

