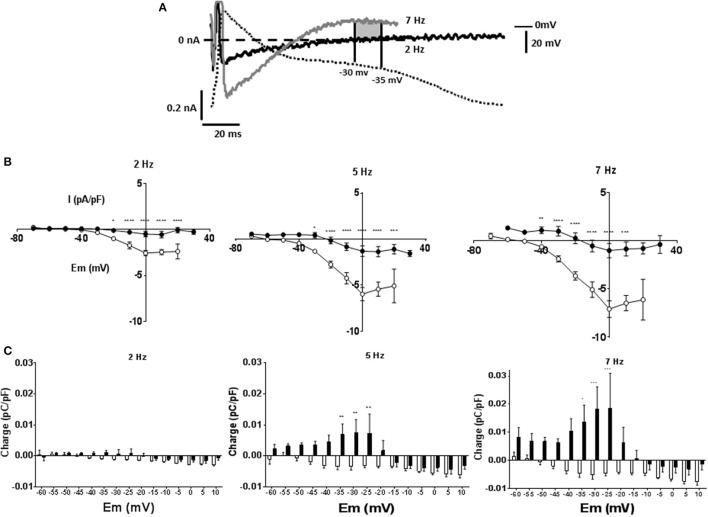
Figure 4.
Myocytes were voltage clamped with the waveform of their own action potential recorded at 1 Hz (AP clamp). Stimulation frequency was increased and currents recorded under AP clamp. (A) Experimental traces illustrating the measurement of membrane current and charge described in panels (B,C) and in Figure 5. A cell is voltage clamped with its free action potential profile recorded at 1 Hz. Current traces are shown when stimulation frequency is increased to 2 and 7 Hz (subtracted from any current recorded at 1 Hz). As stimulation frequency increased an inward current developed early in repolarization and an outward current latter in repolarization. The charge was calculated as the area of current * time passed during a 5 mV change in voltage. The shaded area shows charge passed between the membrane potentials of −30 and −35 mV at a stimulation frequency of 7 Hz, there was minimal current or charge at 2 Hz within this voltage range. (B) Current voltage relationships for 1 Hz subtracted currents at 2, 5, and 7 Hz in CON (°) and MCT (•) myocytes. Inward current early in the simulated AP repolarization was larger in CON than MCT. (C) Charge measured at 5 mV sampling intervals during AP clamp. In CON myocytes charge was predominantly inward whilst in MCT the largest charge was outward. n = 7 CON and 7 MCT myocytes ****P < 0.0001, ***P < 0.001, **P < 0.01, *P < 0.05 CON vs. MCT two way RM ANOVA.

